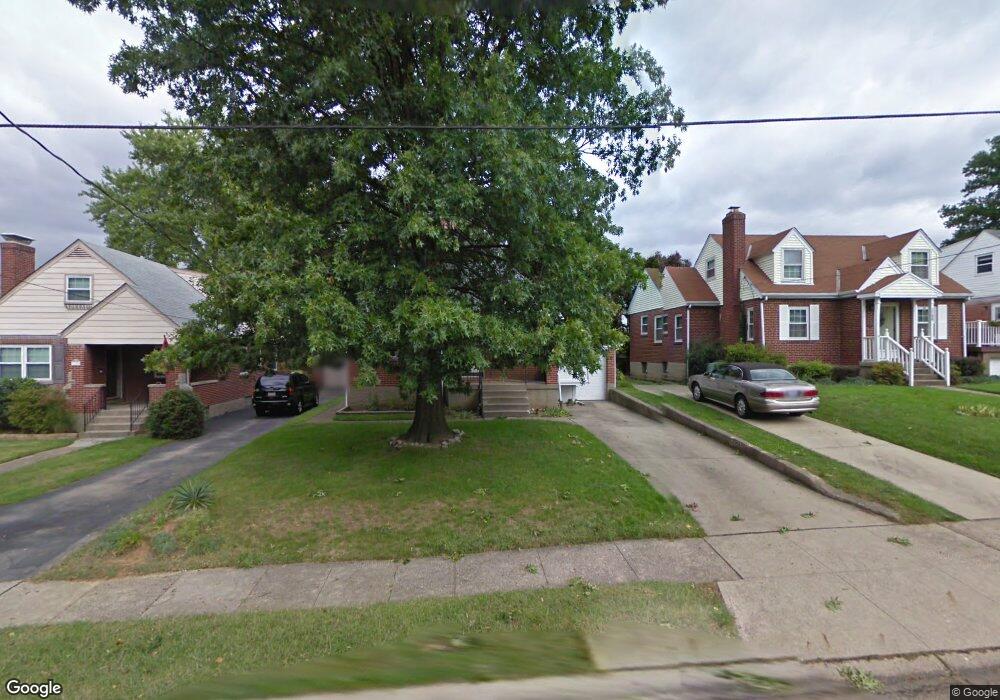
3784 Thornton Dr Cincinnati, OH 45236
Estimated Value: $265,738 - $291,000
3
Beds
3
Baths
1,555
Sq Ft
$179/Sq Ft
Est. Value
About This Home
This home is located at 3784 Thornton Dr, Cincinnati, OH 45236 and is currently estimated at $278,935, approximately $179 per square foot. 3784 Thornton Dr is a home located in Hamilton County with nearby schools including Silverton Paideia Elementary School, Shroder High School, and Clark Montessori High School.
Ownership History
Date
Name
Owned For
Owner Type
Purchase Details
Closed on
Aug 31, 2005
Sold by
Nugent Thomas A and Nugent Lorie S
Bought by
Schuster Mary T
Current Estimated Value
Home Financials for this Owner
Home Financials are based on the most recent Mortgage that was taken out on this home.
Original Mortgage
$136,900
Outstanding Balance
$71,793
Interest Rate
5.93%
Mortgage Type
Fannie Mae Freddie Mac
Estimated Equity
$207,142
Purchase Details
Closed on
Sep 21, 2000
Sold by
Carrier Robert Tr
Bought by
Nugent Thomas A and Nugent Lorie S
Home Financials for this Owner
Home Financials are based on the most recent Mortgage that was taken out on this home.
Original Mortgage
$103,400
Interest Rate
7.99%
Create a Home Valuation Report for This Property
The Home Valuation Report is an in-depth analysis detailing your home's value as well as a comparison with similar homes in the area
Home Values in the Area
Average Home Value in this Area
Purchase History
| Date | Buyer | Sale Price | Title Company |
|---|---|---|---|
| Schuster Mary T | $136,900 | Custom Land Title Llc | |
| Nugent Thomas A | $114,900 | Prodigy Title Agency Inc |
Source: Public Records
Mortgage History
| Date | Status | Borrower | Loan Amount |
|---|---|---|---|
| Open | Schuster Mary T | $136,900 | |
| Previous Owner | Nugent Thomas A | $103,400 |
Source: Public Records
Tax History
| Year | Tax Paid | Tax Assessment Tax Assessment Total Assessment is a certain percentage of the fair market value that is determined by local assessors to be the total taxable value of land and additions on the property. | Land | Improvement |
|---|---|---|---|---|
| 2025 | $4,069 | $58,037 | $10,101 | $47,936 |
| 2023 | $3,449 | $58,037 | $10,101 | $47,936 |
| 2022 | $3,750 | $48,559 | $7,406 | $41,153 |
| 2021 | $3,667 | $48,559 | $7,406 | $41,153 |
| 2020 | $3,378 | $48,559 | $7,406 | $41,153 |
| 2019 | $3,402 | $44,146 | $6,734 | $37,412 |
| 2018 | $3,402 | $44,146 | $6,734 | $37,412 |
| 2017 | $3,229 | $44,146 | $6,734 | $37,412 |
| 2016 | $3,477 | $46,977 | $6,937 | $40,040 |
| 2015 | $3,250 | $46,977 | $6,937 | $40,040 |
| 2014 | $3,251 | $46,977 | $6,937 | $40,040 |
| 2013 | $3,185 | $45,609 | $6,734 | $38,875 |
Source: Public Records
Map
Nearby Homes
- 3805 O'Leary Ave
- 3990 Superior Ave
- 4025 Deer Park Ave
- 4050 O'Leary Ave
- 3566 Amberacres Dr
- 3521 Section Rd
- 7818 Eustis Ct
- 7873 Gail Dr
- 6829 Alpine Ave
- 4123 Hoffman Ave
- 4248 South Ave
- 3360 Legacy Trace
- 6470 Crestview Ave
- 6466 Crestview Ave
- 6454 Crestview Ave
- 6462 Crestview Ave
- 6458 Crestview Ave
- 6460 Mchugh Place
- 3275 Legacy Trace
- 8021 Beech Ave
- 3788 Thornton Dr
- 3780 Thornton Dr
- 3792 Thornton Dr
- 3776 Thornton Dr
- 3815 Gardner Ave
- 3770 Thornton Dr
- 3796 Thornton Dr
- 3819 Gardner Ave
- 3811 Gardner Ave
- 3785 Thornton Dr
- 3783 Thornton Dr
- 3791 Thornton Dr
- 3821 Gardner Ave
- 3768 Thornton Dr
- 3779 Thornton Dr
- 3809 Gardner Ave
- 3809 Gardner Ave Unit 1
- 3795 Thornton Dr
- 31 Thornton Dr Unit 31
- 3799 Thornton Dr
Your Personal Tour Guide
Ask me questions while you tour the home.