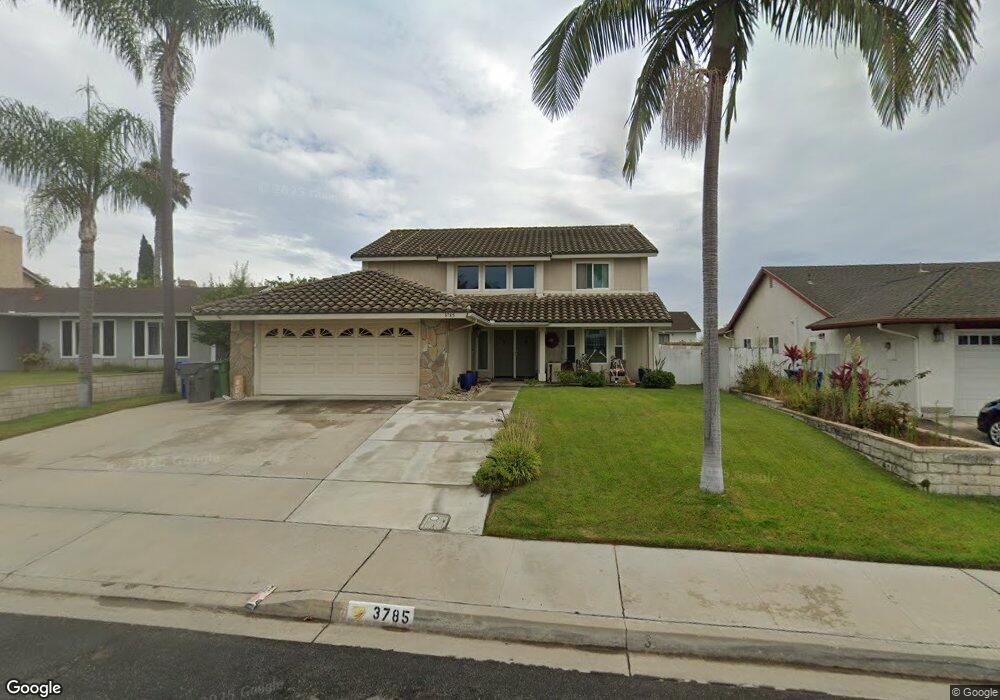
3785 Carnegie Dr Oceanside, CA 92056
Mira Costa NeighborhoodEstimated Value: $953,000 - $1,212,000
4
Beds
3
Baths
2,398
Sq Ft
$442/Sq Ft
Est. Value
About This Home
This home is located at 3785 Carnegie Dr, Oceanside, CA 92056 and is currently estimated at $1,059,925, approximately $442 per square foot. 3785 Carnegie Dr is a home located in San Diego County with nearby schools including Christa McAuliffe Elementary School, Martin Luther King Jr. Middle School, and El Camino High School.
Ownership History
Date
Name
Owned For
Owner Type
Purchase Details
Closed on
Mar 24, 2009
Sold by
Prato Anthony Wayne and Prato Kimberly Dimo
Bought by
Kollar Bachman Renee and Bachman Daniel
Current Estimated Value
Home Financials for this Owner
Home Financials are based on the most recent Mortgage that was taken out on this home.
Original Mortgage
$420,481
Outstanding Balance
$265,806
Interest Rate
5.02%
Mortgage Type
FHA
Estimated Equity
$794,119
Purchase Details
Closed on
Oct 6, 1993
Sold by
Workman Robert Eugene and Workman Rudene S
Bought by
Prato Anthony Wayne and Prato Kimberly Dimo
Home Financials for this Owner
Home Financials are based on the most recent Mortgage that was taken out on this home.
Original Mortgage
$183,998
Interest Rate
6.85%
Mortgage Type
VA
Purchase Details
Closed on
Oct 12, 1988
Create a Home Valuation Report for This Property
The Home Valuation Report is an in-depth analysis detailing your home's value as well as a comparison with similar homes in the area
Home Values in the Area
Average Home Value in this Area
Purchase History
| Date | Buyer | Sale Price | Title Company |
|---|---|---|---|
| Kollar Bachman Renee | $435,000 | California Title Company | |
| Prato Anthony Wayne | $180,500 | -- | |
| -- | $162,400 | -- |
Source: Public Records
Mortgage History
| Date | Status | Borrower | Loan Amount |
|---|---|---|---|
| Open | Kollar Bachman Renee | $420,481 | |
| Previous Owner | Prato Anthony Wayne | $183,998 |
Source: Public Records
Tax History
| Year | Tax Paid | Tax Assessment Tax Assessment Total Assessment is a certain percentage of the fair market value that is determined by local assessors to be the total taxable value of land and additions on the property. | Land | Improvement |
|---|---|---|---|---|
| 2025 | $6,192 | $560,161 | $296,176 | $263,985 |
| 2024 | $6,192 | $549,178 | $290,369 | $258,809 |
| 2023 | $6,001 | $538,411 | $284,676 | $253,735 |
| 2022 | $5,911 | $527,855 | $279,095 | $248,760 |
| 2021 | $5,934 | $517,506 | $273,623 | $243,883 |
| 2020 | $5,751 | $512,201 | $270,818 | $241,383 |
| 2019 | $5,584 | $502,158 | $265,508 | $236,650 |
| 2018 | $5,525 | $492,312 | $260,302 | $232,010 |
| 2017 | $5,424 | $482,660 | $255,199 | $227,461 |
| 2016 | $5,248 | $473,197 | $250,196 | $223,001 |
| 2015 | $5,095 | $466,090 | $246,438 | $219,652 |
| 2014 | $4,898 | $456,961 | $241,611 | $215,350 |
Source: Public Records
Map
Nearby Homes
- 2858 Lehigh Ct
- 2868 Brandeis Dr
- 400 Sea Cliff Way Unit 402
- 3258 San Helena Dr
- 3278 San Tomas Dr
- 3929 Marvin St
- 3531 Cameo Dr Unit 98
- 3945 Shenandoah Dr
- 2385 Rancho Del Oro Rd Unit 59
- 2395 Rancho Del Oro Rd Unit 30
- 2395 Rancho Del Oro Rd Unit 29
- 3376 Corsica Way
- 2801 College Blvd
- 3365 Genoa Way Unit 135
- 4062 Lewis St
- 3315 Genoa Way Unit 96
- 4081 Thomas St
- 3315 Tripoli Way
- 3523 Brody Way
- 3176 Isabella Dr
- 3779 Carnegie Dr
- 3789 Carnegie Dr
- 3778 Stanford Dr
- 3774 Stanford Dr
- 3795 Carnegie Dr
- 3775 Carnegie Dr
- 3782 Stanford Dr
- 3770 Stanford Dr
- 3784 Carnegie Dr
- 3788 Carnegie Dr
- 3802 Stanford Dr
- 3778 Carnegie Dr
- 3771 Carnegie Dr
- 3801 Carnegie Dr
- 3766 Stanford Dr
- 3794 Carnegie Dr
- 3774 Carnegie Dr
- 3806 Stanford Dr
- 3762 Stanford Dr
- 3802 Carnegie Dr
Your Personal Tour Guide
Ask me questions while you tour the home.