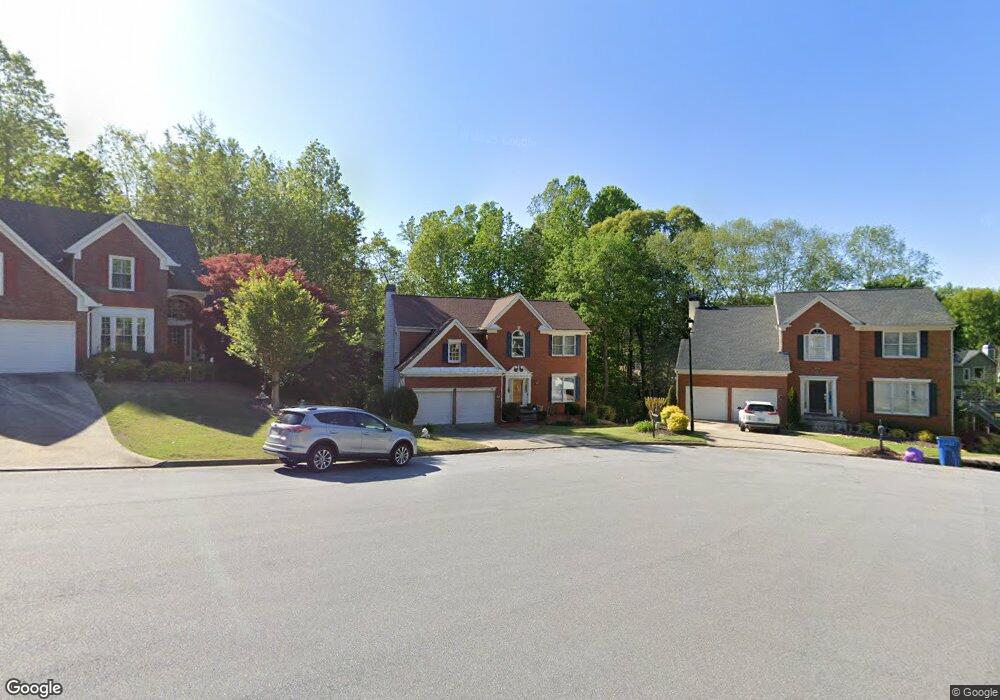
3786 Thornbrooke Ct Duluth, GA 30097
Estimated Value: $474,000 - $526,000
3
Beds
3
Baths
2,648
Sq Ft
$192/Sq Ft
Est. Value
About This Home
This home is located at 3786 Thornbrooke Ct, Duluth, GA 30097 and is currently estimated at $509,160, approximately $192 per square foot. 3786 Thornbrooke Ct is a home located in Gwinnett County with nearby schools including Chattahoochee Elementary School, Coleman Middle School, and Duluth High School.
Ownership History
Date
Name
Owned For
Owner Type
Purchase Details
Closed on
Jul 26, 2005
Sold by
Keyser Daniel S and Keyser Vicki
Bought by
Bhattacharyya Prabir and Bhattacharyya Chandana
Current Estimated Value
Home Financials for this Owner
Home Financials are based on the most recent Mortgage that was taken out on this home.
Original Mortgage
$60,000
Outstanding Balance
$17,946
Interest Rate
5.51%
Mortgage Type
Unknown
Estimated Equity
$491,214
Purchase Details
Closed on
Aug 31, 1994
Sold by
Pulte Home Corp
Bought by
Keyser Daniel S Vicki
Home Financials for this Owner
Home Financials are based on the most recent Mortgage that was taken out on this home.
Original Mortgage
$155,950
Interest Rate
4.87%
Create a Home Valuation Report for This Property
The Home Valuation Report is an in-depth analysis detailing your home's value as well as a comparison with similar homes in the area
Home Values in the Area
Average Home Value in this Area
Purchase History
| Date | Buyer | Sale Price | Title Company |
|---|---|---|---|
| Bhattacharyya Prabir | $258,000 | -- | |
| Keyser Daniel S Vicki | $173,300 | -- |
Source: Public Records
Mortgage History
| Date | Status | Borrower | Loan Amount |
|---|---|---|---|
| Open | Bhattacharyya Prabir | $60,000 | |
| Open | Bhattacharyya Prabir | $198,000 | |
| Previous Owner | Keyser Daniel S Vicki | $155,950 |
Source: Public Records
Tax History
| Year | Tax Paid | Tax Assessment Tax Assessment Total Assessment is a certain percentage of the fair market value that is determined by local assessors to be the total taxable value of land and additions on the property. | Land | Improvement |
|---|---|---|---|---|
| 2025 | $1,139 | $214,200 | $34,000 | $180,200 |
| 2024 | $4,533 | $194,200 | $38,000 | $156,200 |
| 2023 | $4,533 | $194,200 | $38,000 | $156,200 |
| 2022 | $4,356 | $184,720 | $32,000 | $152,720 |
| 2021 | $3,498 | $138,560 | $24,000 | $114,560 |
| 2020 | $3,310 | $128,240 | $21,600 | $106,640 |
| 2019 | $4,194 | $128,240 | $21,600 | $106,640 |
| 2018 | $3,170 | $121,200 | $21,600 | $99,600 |
| 2016 | $2,686 | $98,720 | $19,600 | $79,120 |
| 2015 | $3,153 | $92,440 | $19,600 | $72,840 |
| 2014 | -- | $89,560 | $16,000 | $73,560 |
Source: Public Records
Map
Nearby Homes
- 2643 Timberbrooke Place
- 3833 Stonecroft Place
- 3706 Thornbrooke Ct
- 3614 Clearbrooke Way
- 2711 Old Coach Rd
- 4105 Cavalier Way
- 4220 Cavalier Way
- 3955 Longlake Dr
- 4734 Dewitt Dr
- 4245 Prince Charles Dr
- 3653 North St
- 2765 Olde Towne Pkwy
- 3592 North St
- 3590 North St
- 2870 Towne Village Dr NW
- 2553 Summit Cove Dr Unit 130
- 2755 Pine St
- 4054 Spring Cove Dr
- 4074 Spring Cove Dr
- 2345 Hiawassee Dr
- 3776 Thornbrooke Ct
- 3796 Thornbrooke Ct
- 3811 Stonebriar Ln
- 3766 Thornbrooke Ct
- 3828 Stonecroft Place
- 3806 Thornbrooke Ct
- 3791 Stonebriar Ln
- 3756 Thornbrooke Ct
- 3823 Stonecroft Place
- 3823 Stonecroft Place Unit 94
- 3816 Thornbrooke Ct
- 3816 Thornbrooke Ct Unit 2
- 3838 Stonecroft Place
- 3771 Thornbrooke Ct
- 3821 Stonebriar Ln
- 3811 Thornbrooke Ct
- 3806 Stonebriar Ln
- 3746 Thornbrooke Ct
- 3761 Thornbrooke Ct
- 2653 Timberbrooke Place
Your Personal Tour Guide
Ask me questions while you tour the home.