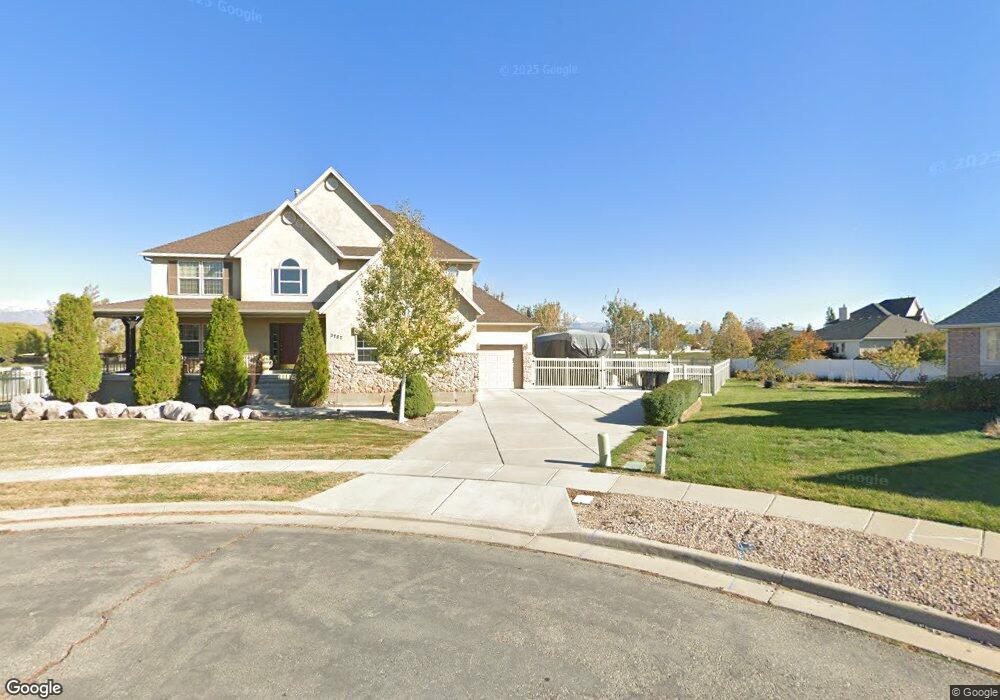
3787 Formby Cir Syracuse, UT 84075
Estimated Value: $592,000 - $731,681
4
Beds
3
Baths
3,990
Sq Ft
$169/Sq Ft
Est. Value
About This Home
This home is located at 3787 Formby Cir, Syracuse, UT 84075 and is currently estimated at $675,920, approximately $169 per square foot. 3787 Formby Cir is a home located in Davis County with nearby schools including Buffalo Point School, Syracuse Junior High School, and Syracuse High School.
Ownership History
Date
Name
Owned For
Owner Type
Purchase Details
Closed on
Mar 5, 2021
Sold by
Nolan Robert L and Nolan Jikza J
Bought by
Nolan Robert L and Nolan Jikza J
Current Estimated Value
Home Financials for this Owner
Home Financials are based on the most recent Mortgage that was taken out on this home.
Original Mortgage
$373,000
Outstanding Balance
$333,607
Interest Rate
2.7%
Mortgage Type
VA
Estimated Equity
$342,313
Purchase Details
Closed on
Jun 24, 2005
Sold by
Smith Crystal Lynn
Bought by
Nolan Robert L and Nolan Jikza J
Home Financials for this Owner
Home Financials are based on the most recent Mortgage that was taken out on this home.
Original Mortgage
$254,600
Interest Rate
5.65%
Mortgage Type
Fannie Mae Freddie Mac
Purchase Details
Closed on
Nov 1, 2004
Sold by
Smith Crystal L
Bought by
Smith Brandon M
Home Financials for this Owner
Home Financials are based on the most recent Mortgage that was taken out on this home.
Original Mortgage
$208,000
Interest Rate
5.5%
Mortgage Type
New Conventional
Create a Home Valuation Report for This Property
The Home Valuation Report is an in-depth analysis detailing your home's value as well as a comparison with similar homes in the area
Home Values in the Area
Average Home Value in this Area
Purchase History
| Date | Buyer | Sale Price | Title Company |
|---|---|---|---|
| Nolan Robert L | -- | Backman Title Services | |
| Nolan Robert L | -- | Bonneville Title Company | |
| Smith Brandon M | -- | Backman Stewart Title Svcs |
Source: Public Records
Mortgage History
| Date | Status | Borrower | Loan Amount |
|---|---|---|---|
| Open | Nolan Robert L | $373,000 | |
| Closed | Nolan Robert L | $254,600 | |
| Previous Owner | Smith Brandon M | $208,000 |
Source: Public Records
Tax History Compared to Growth
Tax History
| Year | Tax Paid | Tax Assessment Tax Assessment Total Assessment is a certain percentage of the fair market value that is determined by local assessors to be the total taxable value of land and additions on the property. | Land | Improvement |
|---|---|---|---|---|
| 2025 | $456 | $356,950 | $126,058 | $230,892 |
| 2024 | $597 | $361,350 | $110,245 | $251,105 |
| 2023 | $655 | $639,000 | $156,434 | $482,566 |
| 2022 | $2,712 | $376,750 | $83,886 | $292,864 |
| 2021 | $1,947 | $493,000 | $121,591 | $371,409 |
| 2020 | $1,584 | $428,000 | $104,425 | $323,575 |
| 2019 | $1,905 | $419,000 | $104,972 | $314,028 |
| 2018 | $1,768 | $394,000 | $100,089 | $293,911 |
| 2016 | $2,597 | $194,040 | $39,041 | $154,999 |
| 2015 | $2,467 | $175,560 | $39,041 | $136,519 |
| 2014 | $2,251 | $163,289 | $39,041 | $124,248 |
| 2013 | -- | $153,224 | $35,621 | $117,603 |
Source: Public Records
Map
Nearby Homes
- 3882 Turnberry Dr
- 3736 W 1225 S
- 3564 Princeville Dr
- 3867 Rungsted Cir
- 3951 Baltimore Cir
- 3579 W 1775 S
- 4191 W 1425 S
- 1441 Brookshire Dr
- 1084 S 4090 W
- 3627 W Augusta Dr
- 1238 S 4290 W
- 1039 S 4250 W
- 3661 W 800 S
- 3649 W 800 S
- 851 S 3525 W
- 3565 W 800 S
- 1157 S 4425 W
- 3704 W 2170 S Unit 111
- 835 S Criddle Rd
- 1155 S 4475 W
- 3787 W Formby Dr
- 3793 Formby Cir
- 3762 Cherry Hills Cir
- 3790 Formby Cir
- 3776 Cherry Hills Cir
- 3801 Formby Cir
- 3801 W Formby Dr
- 3798 W Formby Dr S
- 3798 Formby Cir
- 3796 Cherry Hills Cir
- 3756 Cherry Hills Cir
- 3816 Formby Cir
- 3822 Cherry Hills Cir
- 3821 Prestwick Cir
- 3815 Prestwick Cir
- 3773 Cherry Hills Cir
- 0 Cherry Hills Cir S
- 1483 Prestwick Dr
- 3759 Cherry Hills Cir
- 3832 Formby Cir