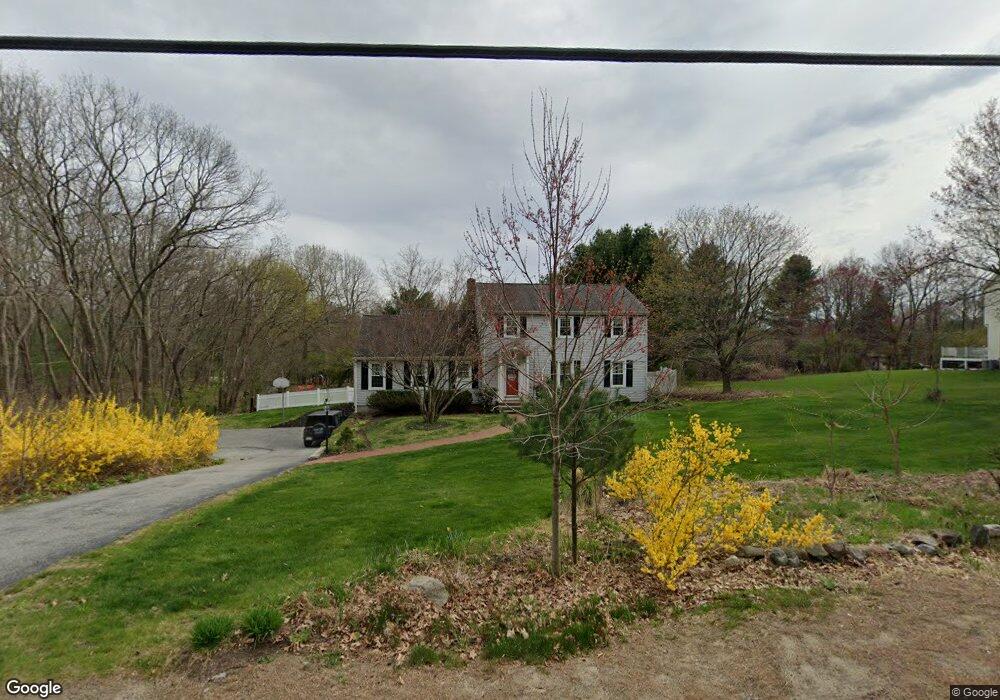
379 Boxford St Unit 1 North Andover, MA 01845
Estimated Value: $845,103 - $940,000
4
Beds
3
Baths
2,240
Sq Ft
$398/Sq Ft
Est. Value
About This Home
This home is located at 379 Boxford St Unit 1, North Andover, MA 01845 and is currently estimated at $891,276, approximately $397 per square foot. 379 Boxford St Unit 1 is a home located in Essex County with nearby schools including Annie L Sargent Elementary School, North Andover Middle School, and North Andover High School.
Ownership History
Date
Name
Owned For
Owner Type
Purchase Details
Closed on
Aug 29, 2011
Sold by
Kauser Seema
Bought by
Lynch Matthew J and Lynch Kathleen A
Current Estimated Value
Home Financials for this Owner
Home Financials are based on the most recent Mortgage that was taken out on this home.
Original Mortgage
$350,874
Outstanding Balance
$240,161
Interest Rate
4.25%
Mortgage Type
FHA
Estimated Equity
$651,115
Create a Home Valuation Report for This Property
The Home Valuation Report is an in-depth analysis detailing your home's value as well as a comparison with similar homes in the area
Home Values in the Area
Average Home Value in this Area
Purchase History
| Date | Buyer | Sale Price | Title Company |
|---|---|---|---|
| Lynch Matthew J | $360,000 | -- |
Source: Public Records
Mortgage History
| Date | Status | Borrower | Loan Amount |
|---|---|---|---|
| Open | Lynch Matthew J | $350,874 |
Source: Public Records
Tax History Compared to Growth
Tax History
| Year | Tax Paid | Tax Assessment Tax Assessment Total Assessment is a certain percentage of the fair market value that is determined by local assessors to be the total taxable value of land and additions on the property. | Land | Improvement |
|---|---|---|---|---|
| 2025 | $8,402 | $746,200 | $372,100 | $374,100 |
| 2024 | $7,957 | $717,500 | $350,300 | $367,200 |
| 2023 | $7,879 | $643,700 | $321,700 | $322,000 |
| 2022 | $7,621 | $563,300 | $289,000 | $274,300 |
| 2021 | $7,306 | $515,600 | $262,900 | $252,700 |
| 2020 | $7,084 | $515,600 | $262,900 | $252,700 |
| 2019 | $6,914 | $515,600 | $262,900 | $252,700 |
| 2018 | $7,492 | $515,600 | $262,900 | $252,700 |
| 2017 | $6,265 | $438,700 | $208,100 | $230,600 |
| 2016 | $5,923 | $415,100 | $204,100 | $211,000 |
| 2015 | $6,002 | $417,100 | $200,900 | $216,200 |
Source: Public Records
Map
Nearby Homes
- Lot 10 Stonecleave Rd
- 114 Stonecleave Rd
- 590 Foster St
- 53 Lawrence Rd
- 50 Stonecleave Rd
- Lot 2 (31) Lawrence Rd
- 10 Woodchuck Ln
- 851 Forest St
- 121 Cortland Dr
- 141 Cortland Dr Unit 141
- 141 Cortland Dr
- 55 Sheffield Rd
- 2 Lawrence Rd
- 39 Sheffield Rd
- 660 Sharpners Pond Rd
- 45 Thistle Rd
- 75 Thistle Rd
- 480 Sharpners Pond Rd
- 12 Farnum St
- 7 Sullivan St
- 379 Boxford St
- 353 Boxford St
- 0 Stonecleave Rd
- 10 Stonecleave Rd
- 380 Boxford St
- 26 Stonecleave Rd
- 425 Boxford St
- 11 Stonecleave Rd
- 405 Boxford St
- 31 Stonecleave Rd
- 38 Stonecleave Rd
- 37 Stonecleave Rd
- 439 Boxford St
- 434 Boxford St
- 415 Boxford St
- 44 Sherwood Dr
- 50 Stonecleave Rd
- 50 Sherwood Dr
- 320 Boxford St
- 448 Boxford St