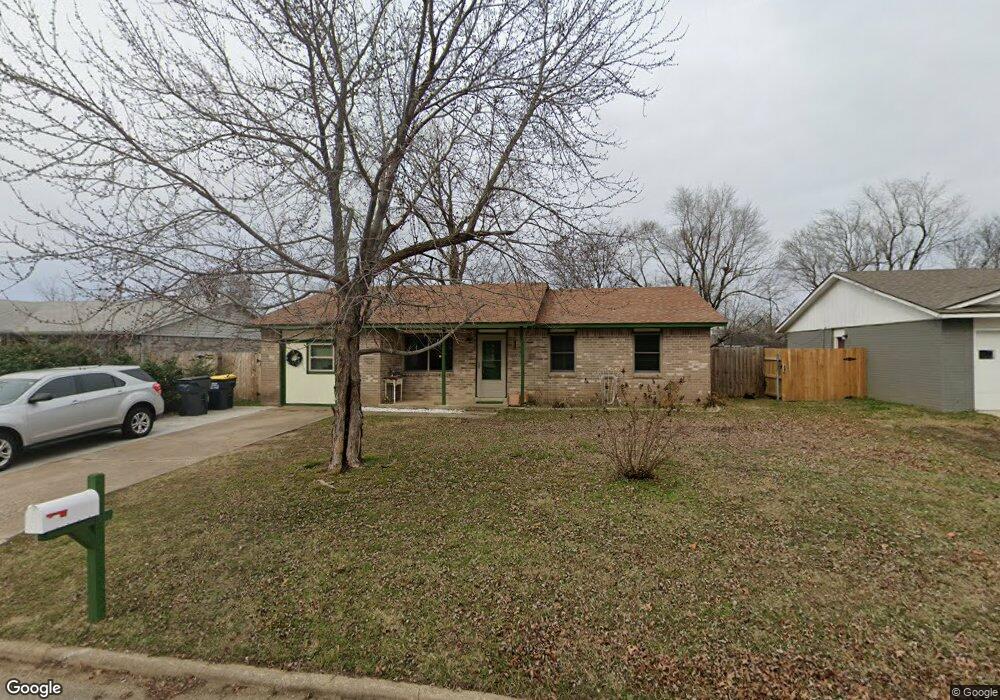
379 E 137th St Glenpool, OK 74033
Estimated Value: $175,000 - $185,000
3
Beds
2
Baths
1,158
Sq Ft
$156/Sq Ft
Est. Value
About This Home
This home is located at 379 E 137th St, Glenpool, OK 74033 and is currently estimated at $180,789, approximately $156 per square foot. 379 E 137th St is a home located in Tulsa County with nearby schools including Glenpool Elementary School, Glenpool Middle School, and Glenpool High School.
Ownership History
Date
Name
Owned For
Owner Type
Purchase Details
Closed on
Mar 27, 2024
Sold by
Smith Donna M
Bought by
Fast Donna M and Fast Greg R
Current Estimated Value
Purchase Details
Closed on
Apr 24, 2007
Sold by
Fast Greg R
Bought by
Smith Donna M and Fast Greg R
Purchase Details
Closed on
Apr 18, 2007
Sold by
Smith Donna M
Bought by
Fast Greg R
Purchase Details
Closed on
Jun 27, 1997
Sold by
Hester Clifford W and Hester Chryl
Bought by
Smith Miles E and Smith Donna M
Purchase Details
Closed on
Nov 1, 1996
Purchase Details
Closed on
Mar 1, 1991
Create a Home Valuation Report for This Property
The Home Valuation Report is an in-depth analysis detailing your home's value as well as a comparison with similar homes in the area
Home Values in the Area
Average Home Value in this Area
Purchase History
| Date | Buyer | Sale Price | Title Company |
|---|---|---|---|
| Fast Donna M | -- | None Listed On Document | |
| Smith Donna M | -- | Apex Title & Closing Service | |
| Fast Greg R | -- | Apex Title & Closings Servic | |
| Smith Miles E | $51,000 | Frisco Title Corp | |
| -- | $31,000 | -- | |
| -- | $29,000 | -- |
Source: Public Records
Tax History
| Year | Tax Paid | Tax Assessment Tax Assessment Total Assessment is a certain percentage of the fair market value that is determined by local assessors to be the total taxable value of land and additions on the property. | Land | Improvement |
|---|---|---|---|---|
| 2025 | $1,533 | $10,949 | $1,414 | $9,535 |
| 2024 | $1,384 | $12,417 | $1,896 | $10,521 |
| 2023 | $1,384 | $11,826 | $1,969 | $9,857 |
| 2022 | $1,298 | $11,262 | $2,413 | $8,849 |
| 2021 | $1,255 | $10,726 | $2,298 | $8,428 |
| 2020 | $1,204 | $10,216 | $2,189 | $8,027 |
| 2019 | $1,155 | $9,729 | $2,085 | $7,644 |
| 2018 | $1,095 | $9,266 | $1,986 | $7,280 |
| 2017 | $1,021 | $8,825 | $1,891 | $6,934 |
| 2016 | $1,031 | $8,825 | $1,891 | $6,934 |
| 2015 | $1,016 | $8,825 | $1,891 | $6,934 |
| 2014 | $972 | $8,325 | $1,784 | $6,541 |
Source: Public Records
Map
Nearby Homes
- 13826 S Elm St
- 582 E 133rd Place
- 661 E 133rd Place
- 501 E 141st Place
- 13674 S Maple St
- 14336 S Barber St
- 687 E 142nd Place
- 1104 E 137th St
- 1024 E 135th Place
- 13796 S Nyssa Place
- 1211 E 135th St
- 243 E 141st St
- 13706 Peabody Dr
- 1221 E 134th St
- 13761 S Nyssa Ct
- 1171 E 133rd St
- 13503 S Oak Ct
- 41 E 148th St
- 1671 E 140th St
- 13773 S Oak Place
- 387 E 137th St
- 355 E 137th St
- 342 E 136th Place
- 368 E 136th Place
- 341 E 137th St
- 326 E 136th Place
- 384 E 136th Place
- 392 E 137th St
- 364 E 137th St
- 327 E 137th St
- 423 E 137th St
- 346 E 137th St
- 416 E 137th St
- 437 E 137th St S
- 396 E 136th Place
- 303 E 137th St
- 332 E 137th St
- 430 E 137th St
- 445 E 137th St
- 290 E 136th Place
Your Personal Tour Guide
Ask me questions while you tour the home.