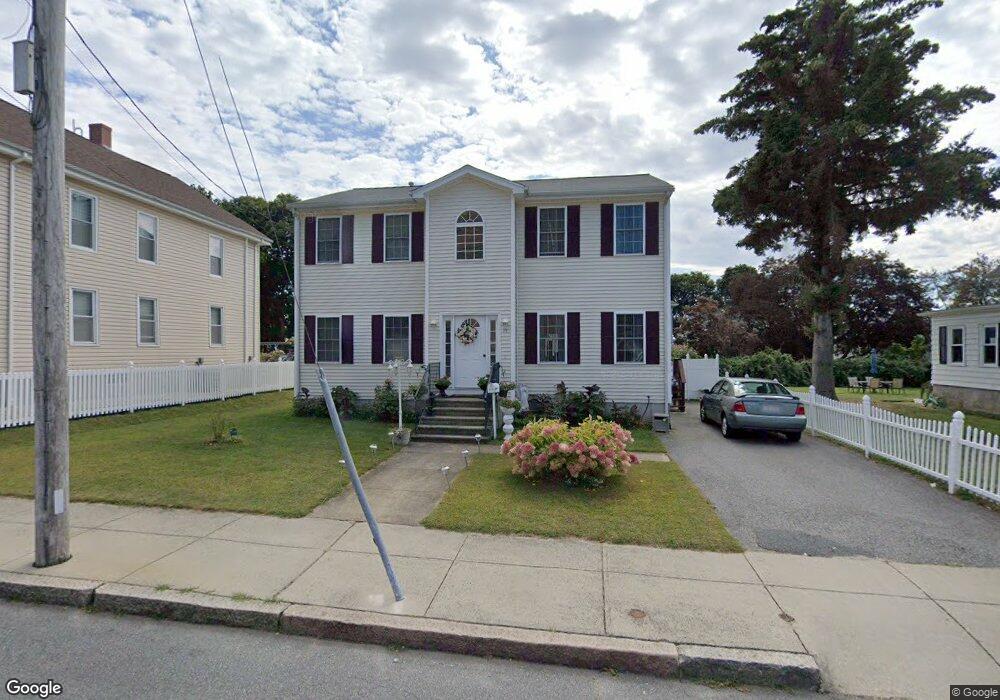
379 Field St Fall River, MA 02721
Maplewood NeighborhoodEstimated Value: $512,823 - $558,000
3
Beds
3
Baths
2,048
Sq Ft
$260/Sq Ft
Est. Value
About This Home
This home is located at 379 Field St, Fall River, MA 02721 and is currently estimated at $532,956, approximately $260 per square foot. 379 Field St is a home located in Bristol County with nearby schools including Letourneau Elementary School, Matthew J. Kuss Middle School, and B M C Durfee High School.
Ownership History
Date
Name
Owned For
Owner Type
Purchase Details
Closed on
Jan 30, 2006
Sold by
Grattan St Rt and Cabral Timothy F
Bought by
Caetano Luis M
Current Estimated Value
Home Financials for this Owner
Home Financials are based on the most recent Mortgage that was taken out on this home.
Original Mortgage
$70,000
Outstanding Balance
$39,733
Interest Rate
6.34%
Mortgage Type
Purchase Money Mortgage
Estimated Equity
$493,223
Purchase Details
Closed on
Jul 27, 2005
Sold by
Perry Evelyn
Bought by
Grattan Street Rt and Cabral Timothy
Create a Home Valuation Report for This Property
The Home Valuation Report is an in-depth analysis detailing your home's value as well as a comparison with similar homes in the area
Home Values in the Area
Average Home Value in this Area
Purchase History
| Date | Buyer | Sale Price | Title Company |
|---|---|---|---|
| Caetano Luis M | $314,600 | -- | |
| Grattan Street Rt | $115,000 | -- |
Source: Public Records
Mortgage History
| Date | Status | Borrower | Loan Amount |
|---|---|---|---|
| Open | Caetano Luis M | $70,000 |
Source: Public Records
Tax History
| Year | Tax Paid | Tax Assessment Tax Assessment Total Assessment is a certain percentage of the fair market value that is determined by local assessors to be the total taxable value of land and additions on the property. | Land | Improvement |
|---|---|---|---|---|
| 2025 | $5,107 | $446,000 | $126,600 | $319,400 |
| 2024 | $4,765 | $414,700 | $121,800 | $292,900 |
| 2023 | $4,796 | $390,900 | $104,400 | $286,500 |
| 2022 | $4,199 | $332,700 | $94,900 | $237,800 |
| 2021 | $4,059 | $293,500 | $87,900 | $205,600 |
| 2020 | $3,995 | $276,500 | $84,100 | $192,400 |
| 2019 | $3,855 | $264,400 | $80,100 | $184,300 |
| 2018 | $3,646 | $249,400 | $78,600 | $170,800 |
| 2017 | $3,472 | $248,000 | $80,200 | $167,800 |
| 2016 | $3,142 | $230,500 | $83,500 | $147,000 |
| 2015 | $2,991 | $228,700 | $80,400 | $148,300 |
| 2014 | $2,930 | $232,900 | $84,600 | $148,300 |
Source: Public Records
Map
Nearby Homes
Your Personal Tour Guide
Ask me questions while you tour the home.