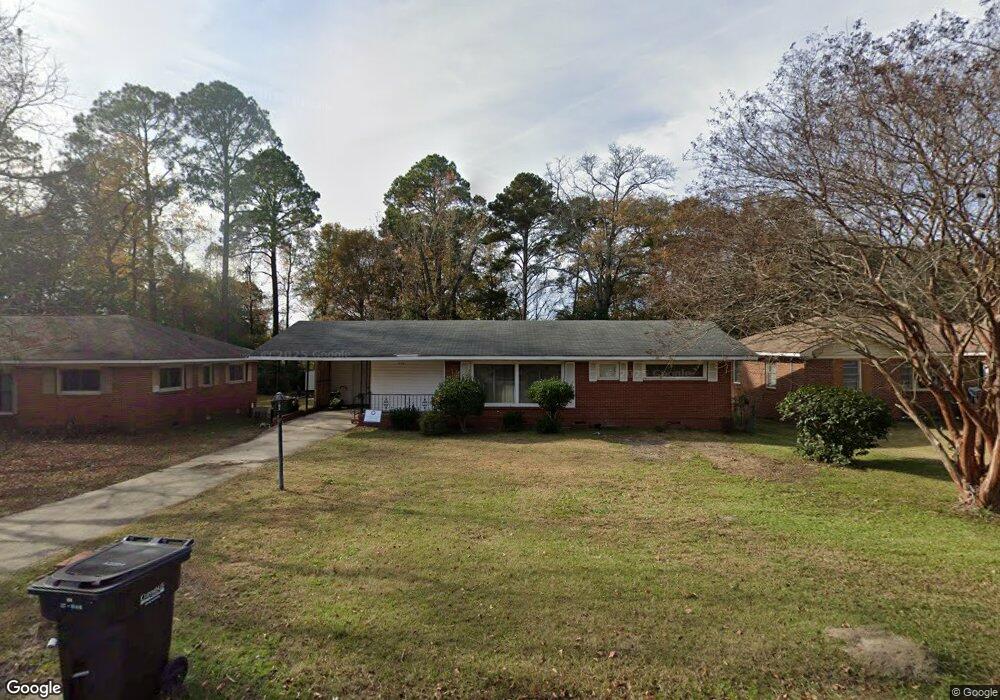
379 Olsen Ave Columbus, GA 31907
Eastern Columbus NeighborhoodEstimated Value: $115,000 - $124,737
2
Beds
2
Baths
1,193
Sq Ft
$100/Sq Ft
Est. Value
About This Home
This home is located at 379 Olsen Ave, Columbus, GA 31907 and is currently estimated at $119,434, approximately $100 per square foot. 379 Olsen Ave is a home located in Muscogee County with nearby schools including Dimon Elementary School, Rothschild Leadership Academy, and Kendrick High School.
Ownership History
Date
Name
Owned For
Owner Type
Purchase Details
Closed on
Feb 28, 2020
Sold by
Warner Stanton Kathy L
Bought by
Crimbley Desiree Nicole
Current Estimated Value
Home Financials for this Owner
Home Financials are based on the most recent Mortgage that was taken out on this home.
Original Mortgage
$70,000
Outstanding Balance
$48,587
Interest Rate
3.6%
Mortgage Type
New Conventional
Estimated Equity
$70,847
Purchase Details
Closed on
Feb 20, 2019
Sold by
Gary Lisa M
Bought by
Warner Kathy L and Stanton Cedrica
Purchase Details
Closed on
Dec 18, 2017
Sold by
Cherry Charlie
Bought by
Gary Lisa M
Purchase Details
Closed on
Jul 7, 2010
Sold by
Davis Lillie C
Bought by
Cherry Charlie and Davis Lillie C
Purchase Details
Closed on
Nov 8, 2007
Sold by
Davis Lillie C
Bought by
Cherry Charlie
Create a Home Valuation Report for This Property
The Home Valuation Report is an in-depth analysis detailing your home's value as well as a comparison with similar homes in the area
Home Values in the Area
Average Home Value in this Area
Purchase History
| Date | Buyer | Sale Price | Title Company |
|---|---|---|---|
| Crimbley Desiree Nicole | $70,000 | -- | |
| Warner Kathy L | -- | -- | |
| Gary Lisa M | $500 | -- | |
| Cherry Charlie | -- | None Available | |
| Cherry Charlie | -- | None Available |
Source: Public Records
Mortgage History
| Date | Status | Borrower | Loan Amount |
|---|---|---|---|
| Open | Crimbley Desiree Nicole | $70,000 |
Source: Public Records
Tax History Compared to Growth
Tax History
| Year | Tax Paid | Tax Assessment Tax Assessment Total Assessment is a certain percentage of the fair market value that is determined by local assessors to be the total taxable value of land and additions on the property. | Land | Improvement |
|---|---|---|---|---|
| 2025 | $580 | $43,268 | $6,468 | $36,800 |
| 2024 | $579 | $43,268 | $6,468 | $36,800 |
| 2023 | $23 | $43,268 | $6,468 | $36,800 |
| 2022 | $603 | $32,580 | $6,468 | $26,112 |
| 2021 | $632 | $28,000 | $6,440 | $21,560 |
| 2020 | $509 | $12,464 | $6,468 | $5,996 |
| 2019 | $511 | $12,464 | $6,468 | $5,996 |
| 2018 | $942 | $27,052 | $6,468 | $20,584 |
| 2017 | $1,112 | $27,052 | $6,468 | $20,584 |
| 2016 | $1,281 | $31,064 | $4,098 | $26,966 |
| 2015 | $1,283 | $31,064 | $4,098 | $26,966 |
| 2014 | $1,285 | $31,064 | $4,098 | $26,966 |
| 2013 | -- | $31,064 | $4,098 | $26,966 |
Source: Public Records
Map
Nearby Homes
- 392 Olsen Ave
- 391 & 401 Victoria Dr
- 4414 Curry St
- 410 McCartha Dr
- 418 Henson Ave
- 4801 Allen St
- 533 Englewood Dr
- 4534 Sentry St
- 4459 Bermuda St
- 636 Dogwood Dr
- 4846 Maplewood Dr
- 4422 Pate Dr
- 4516 Sims St
- 5003 Shirley Ann Dr
- 644 Georgia Dr
- 754 Wright Dr
- 4437 St Marys Rd
- 5021 Shirley Ann Dr
- 3943 Curry St
- 766 Cardinal Ave