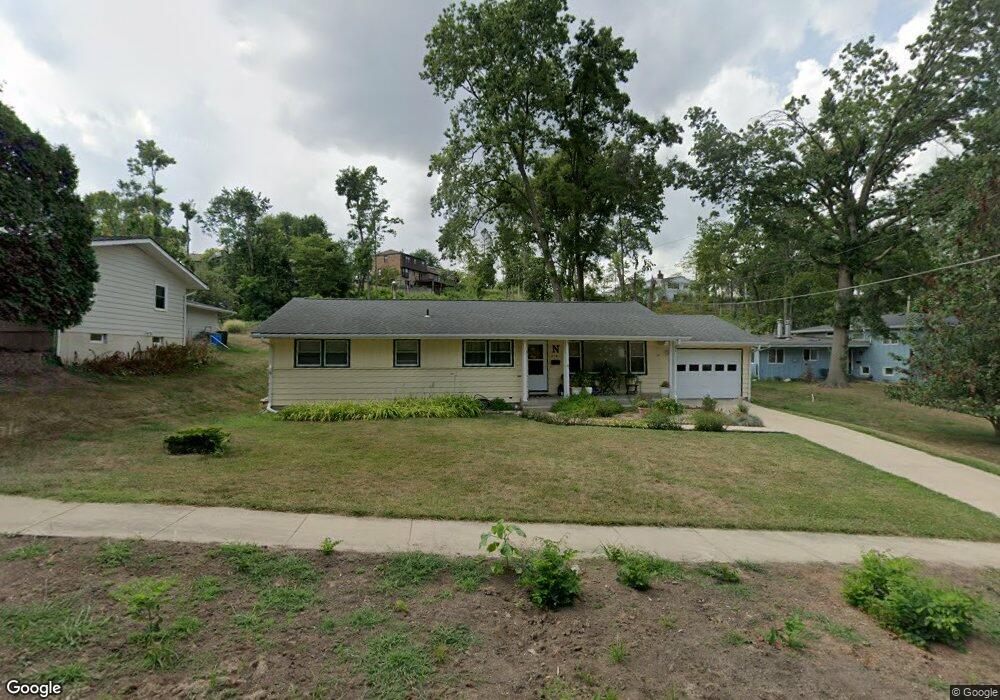
379 Red Fox Rd SE Cedar Rapids, IA 52403
Estimated Value: $203,000 - $231,000
3
Beds
2
Baths
1,324
Sq Ft
$168/Sq Ft
Est. Value
About This Home
This home is located at 379 Red Fox Rd SE, Cedar Rapids, IA 52403 and is currently estimated at $221,995, approximately $167 per square foot. 379 Red Fox Rd SE is a home located in Linn County with nearby schools including Erskine Elementary School, McKinley STEAM Academy, and George Washington High School.
Ownership History
Date
Name
Owned For
Owner Type
Purchase Details
Closed on
Dec 4, 2013
Sold by
Burris Harold H and Burris Michaele G
Bought by
Nyane Mamonate R
Current Estimated Value
Home Financials for this Owner
Home Financials are based on the most recent Mortgage that was taken out on this home.
Original Mortgage
$6,600
Outstanding Balance
$4,919
Interest Rate
4.14%
Mortgage Type
Stand Alone Second
Estimated Equity
$217,076
Create a Home Valuation Report for This Property
The Home Valuation Report is an in-depth analysis detailing your home's value as well as a comparison with similar homes in the area
Home Values in the Area
Average Home Value in this Area
Purchase History
| Date | Buyer | Sale Price | Title Company |
|---|---|---|---|
| Nyane Mamonate R | $132,000 | None Available |
Source: Public Records
Mortgage History
| Date | Status | Borrower | Loan Amount |
|---|---|---|---|
| Open | Nyane Mamonate R | $6,600 |
Source: Public Records
Tax History Compared to Growth
Tax History
| Year | Tax Paid | Tax Assessment Tax Assessment Total Assessment is a certain percentage of the fair market value that is determined by local assessors to be the total taxable value of land and additions on the property. | Land | Improvement |
|---|---|---|---|---|
| 2025 | $3,144 | $204,800 | $50,500 | $154,300 |
| 2024 | $3,442 | $203,600 | $50,500 | $153,100 |
| 2023 | $3,442 | $195,100 | $50,500 | $144,600 |
| 2022 | $3,002 | $172,100 | $39,500 | $132,600 |
| 2021 | $3,206 | $153,900 | $39,500 | $114,400 |
| 2020 | $3,206 | $153,900 | $35,100 | $118,800 |
| 2019 | $2,882 | $142,200 | $35,100 | $107,100 |
| 2018 | $2,798 | $142,200 | $35,100 | $107,100 |
| 2017 | $2,894 | $141,400 | $35,100 | $106,300 |
| 2016 | $2,955 | $139,000 | $35,100 | $103,900 |
| 2015 | $2,983 | $140,196 | $35,136 | $105,060 |
| 2014 | $2,798 | $136,655 | $35,136 | $101,519 |
| 2013 | $2,590 | $136,655 | $35,136 | $101,519 |
Source: Public Records
Map
Nearby Homes
- 380 Indiandale Rd SE
- 3830 Skylark Ln SE
- 2227 Kestrel Dr SE
- 2403 Kestrel Dr SE
- 2416 Kestrel Dr SE
- 2226 Kestrel Dr SE
- 3112 Peregrine Ct SE
- 2306 Kestrel Dr SE
- 2420 Kestrel Dr SE
- 2409 Kestrel Dr SE
- 2421 Kestrel Dr SE
- 2221 Kestrel Dr SE
- 2319 Kestrel Dr SE
- 2415 Kestrel Dr SE
- 2325 Kestrel Dr SE
- 2313 Kestrel Dr SE
- 2307 Kestrel Dr SE
- 2312 Kestrel Dr SE
- 3100 Peregrine Ct SE
- 2215 Kestrel Dr SE
- 383 Red Fox Rd SE
- 361 Red Fox Rd SE
- 357 Red Fox Rd SE
- 3854 Lost Valley Rd SE
- 3852 Lost Valley Rd SE
- 395 Red Fox Rd SE
- 380 Red Fox Rd SE
- 360 Red Fox Rd SE
- 3845 Indiandale Cir SE
- 390 Red Fox Rd SE
- 3856 Lost Valley Rd SE
- 351 Red Fox Rd SE
- 401 Red Fox Rd SE
- 3850 Indiandale Cir SE
- 356 Red Fox Rd SE
- 3858 Lost Valley Rd SE
- 407 Red Fox Rd SE
- 359 Parkland Dr SE
- 350 Red Fox Rd SE
- 343 Red Fox Rd SE