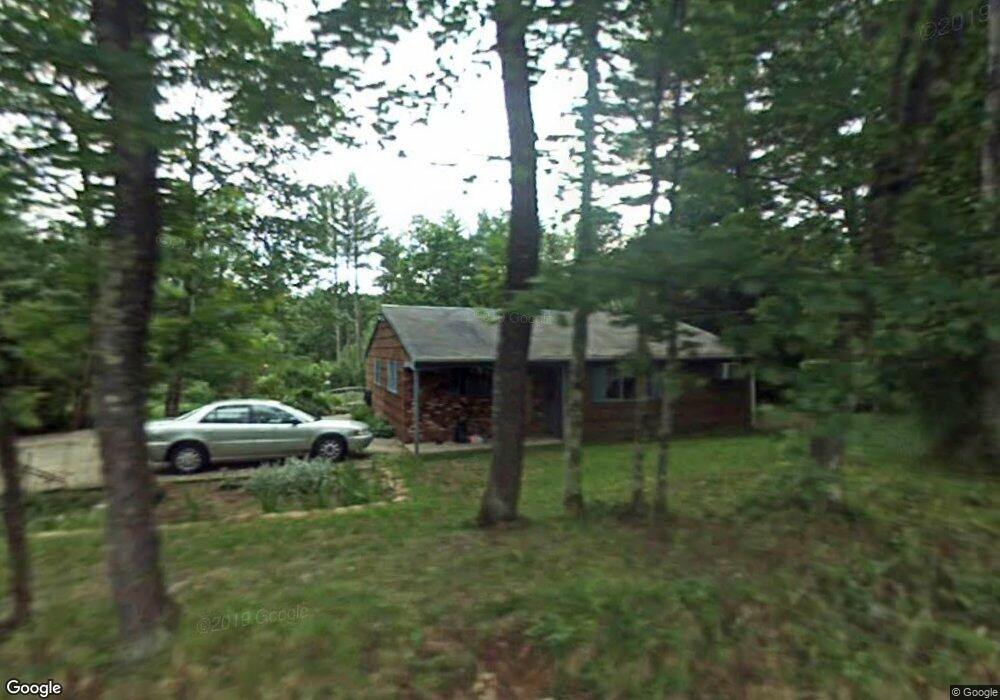
379 Tully Rd Orange, MA 01364
Estimated Value: $319,000 - $697,000
3
Beds
1
Bath
1,202
Sq Ft
$358/Sq Ft
Est. Value
About This Home
This home is located at 379 Tully Rd, Orange, MA 01364 and is currently estimated at $430,657, approximately $358 per square foot. 379 Tully Rd is a home located in Franklin County with nearby schools including Fisher Hill and Ralph C Mahar Regional School.
Ownership History
Date
Name
Owned For
Owner Type
Purchase Details
Closed on
Jun 18, 2020
Sold by
Rzasa Natalie E
Bought by
Rzasa Charles
Current Estimated Value
Purchase Details
Closed on
Dec 14, 1978
Bought by
Rzasa Robert F and Hughes Natalie E
Create a Home Valuation Report for This Property
The Home Valuation Report is an in-depth analysis detailing your home's value as well as a comparison with similar homes in the area
Home Values in the Area
Average Home Value in this Area
Purchase History
| Date | Buyer | Sale Price | Title Company |
|---|---|---|---|
| Rzasa Charles | -- | None Available | |
| Rzasa Robert F | -- | -- |
Source: Public Records
Mortgage History
| Date | Status | Borrower | Loan Amount |
|---|---|---|---|
| Previous Owner | Rzasa Robert F | $52,800 | |
| Previous Owner | Rzasa Robert F | $23,000 |
Source: Public Records
Tax History
| Year | Tax Paid | Tax Assessment Tax Assessment Total Assessment is a certain percentage of the fair market value that is determined by local assessors to be the total taxable value of land and additions on the property. | Land | Improvement |
|---|---|---|---|---|
| 2025 | $43 | $259,500 | $35,000 | $224,500 |
| 2024 | $4,034 | $231,300 | $35,000 | $196,300 |
| 2023 | $3,890 | $216,600 | $35,000 | $181,600 |
| 2022 | $3,646 | $190,700 | $35,000 | $155,700 |
| 2021 | $3,238 | $161,500 | $51,600 | $109,900 |
| 2020 | $3,186 | $156,700 | $51,200 | $105,500 |
| 2019 | $2,916 | $129,500 | $44,600 | $84,900 |
| 2018 | $2,729 | $124,400 | $41,600 | $82,800 |
| 2017 | $2,641 | $124,400 | $41,600 | $82,800 |
| 2016 | $2,634 | $121,400 | $41,600 | $79,800 |
| 2015 | $2,563 | $123,400 | $41,600 | $81,800 |
| 2014 | $2,499 | $126,600 | $41,600 | $85,000 |
Source: Public Records
Map
Nearby Homes
Your Personal Tour Guide
Ask me questions while you tour the home.