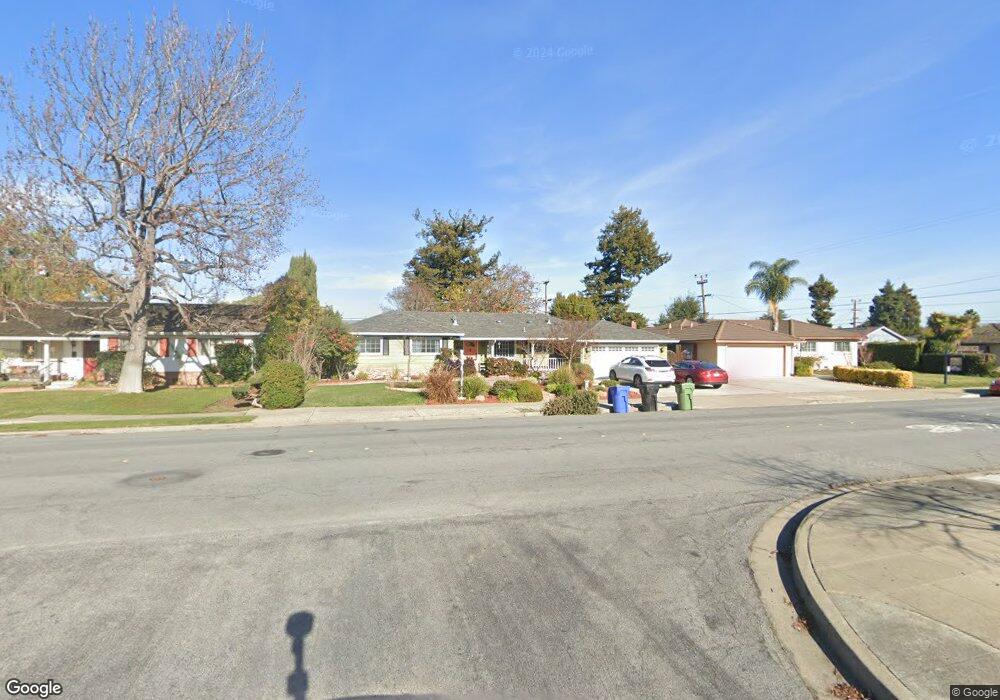
37900 Logan Dr Fremont, CA 94536
Glenmoor NeighborhoodEstimated Value: $1,669,000 - $1,792,000
3
Beds
2
Baths
1,592
Sq Ft
$1,077/Sq Ft
Est. Value
About This Home
This home is located at 37900 Logan Dr, Fremont, CA 94536 and is currently estimated at $1,714,332, approximately $1,076 per square foot. 37900 Logan Dr is a home located in Alameda County with nearby schools including Glenmoor Elementary School, Centerville Junior High School, and Washington High School.
Ownership History
Date
Name
Owned For
Owner Type
Purchase Details
Closed on
May 24, 2011
Sold by
Gerards Lisa
Bought by
Labrutto Christopher and Labrutto Young Mi
Current Estimated Value
Home Financials for this Owner
Home Financials are based on the most recent Mortgage that was taken out on this home.
Original Mortgage
$450,000
Outstanding Balance
$312,152
Interest Rate
4.84%
Mortgage Type
New Conventional
Estimated Equity
$1,402,180
Purchase Details
Closed on
Jul 7, 2008
Sold by
Gerards Pierre
Bought by
Gerards Lisa
Home Financials for this Owner
Home Financials are based on the most recent Mortgage that was taken out on this home.
Original Mortgage
$547,500
Interest Rate
6%
Mortgage Type
Purchase Money Mortgage
Purchase Details
Closed on
Mar 8, 1995
Sold by
Torke Samuel R and Torke Richard Pamela M
Bought by
Gerards Pierre and Gerards Lisa
Home Financials for this Owner
Home Financials are based on the most recent Mortgage that was taken out on this home.
Original Mortgage
$236,800
Interest Rate
8.86%
Create a Home Valuation Report for This Property
The Home Valuation Report is an in-depth analysis detailing your home's value as well as a comparison with similar homes in the area
Home Values in the Area
Average Home Value in this Area
Purchase History
| Date | Buyer | Sale Price | Title Company |
|---|---|---|---|
| Labrutto Christopher | $649,000 | First American Title Company | |
| Gerards Lisa | $292,000 | First American Title Company | |
| Gerards Pierre | $296,000 | Placer Title Company |
Source: Public Records
Mortgage History
| Date | Status | Borrower | Loan Amount |
|---|---|---|---|
| Open | Labrutto Christopher | $450,000 | |
| Previous Owner | Gerards Lisa | $547,500 | |
| Previous Owner | Gerards Pierre | $236,800 |
Source: Public Records
Tax History Compared to Growth
Tax History
| Year | Tax Paid | Tax Assessment Tax Assessment Total Assessment is a certain percentage of the fair market value that is determined by local assessors to be the total taxable value of land and additions on the property. | Land | Improvement |
|---|---|---|---|---|
| 2025 | $10,051 | $831,048 | $249,314 | $581,734 |
| 2024 | $10,051 | $814,760 | $244,428 | $570,332 |
| 2023 | $9,782 | $798,788 | $239,636 | $559,152 |
| 2022 | $9,656 | $783,130 | $234,939 | $548,191 |
| 2021 | $9,420 | $767,774 | $230,332 | $537,442 |
| 2020 | $9,446 | $759,905 | $227,971 | $531,934 |
| 2019 | $9,339 | $745,011 | $223,503 | $521,508 |
| 2018 | $9,157 | $730,410 | $219,123 | $511,287 |
| 2017 | $8,929 | $716,093 | $214,828 | $501,265 |
| 2016 | $8,778 | $702,054 | $210,616 | $491,438 |
| 2015 | $8,662 | $691,513 | $207,454 | $484,059 |
| 2014 | $8,515 | $677,968 | $203,390 | $474,578 |
Source: Public Records
Map
Nearby Homes
- 4586 Norris Rd
- 37721 Madera Ct
- 38265 Corrigan Ct
- 4328 Cognina Ct
- 4715 Eggers Dr
- 4737 Deadwood Dr
- 38324 Blacow Rd
- 4754 Northdale Dr
- 37987 Alta Dr
- Plan 1629 at Veranda
- Plan 1165 at Veranda
- Plan 1670 at Veranda
- Plan 1455 at Veranda
- Plan 1394 at Veranda
- Plan 1725 at Veranda
- Plan 1378 at Veranda
- Plan 1657 at Veranda
- 3810 Burton Common
- 3833 Burton Common
- 4237 Garland Dr
- 37930 Logan Dr
- 37864 Logan Dr
- 37881 Andrews Ct
- 37861 Andrews Ct
- 37925 Logan Dr
- 37830 Logan Dr
- 37988 Logan Dr
- 4481 Norris Rd
- 37831 Logan Dr
- 4467 Norris Rd
- 37841 Andrews Ct
- 37991 Logan Dr
- 4520 Logan Ct
- 37816 Logan Dr
- 4519 Logan Ct
- 4451 Norris Rd
- 4515 Norris Rd
- 37815 Logan Dr
- 37882 Andrews Ct
- 37821 Andrews Ct