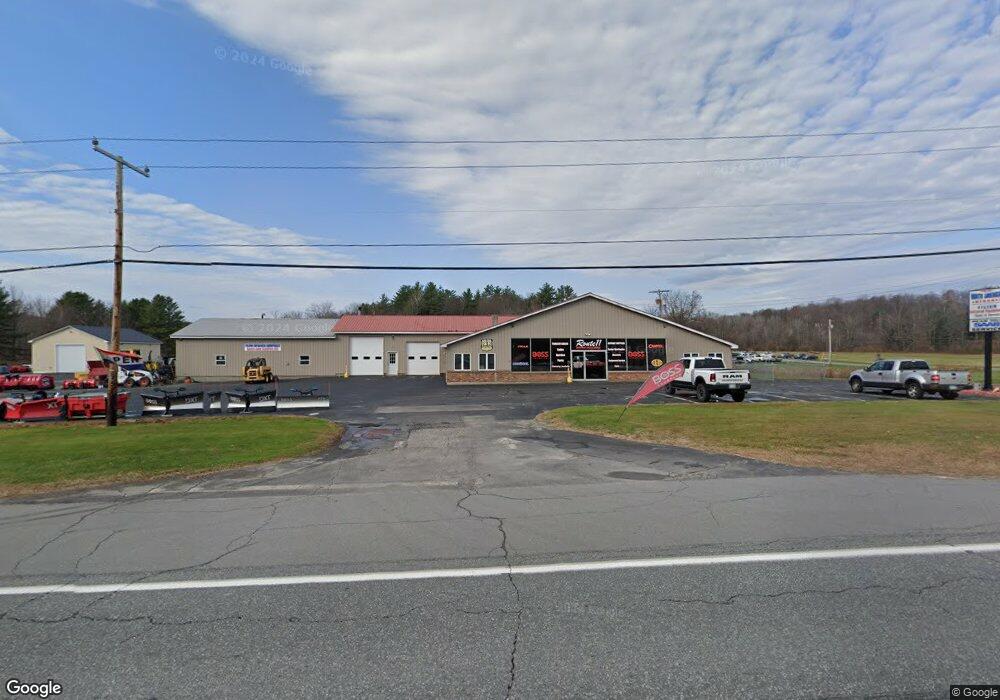
3791 Claremont Rd Charlestown, NH 03603
Estimated Value: $724,073
3
Beds
2
Baths
8,433
Sq Ft
$86/Sq Ft
Est. Value
About This Home
This home is located at 3791 Claremont Rd, Charlestown, NH 03603 and is currently estimated at $724,073, approximately $85 per square foot. 3791 Claremont Rd is a home located in Sullivan County with nearby schools including North Charlestown Community School, Charlestown Middle School, and Fall Mountain Regional High School.
Ownership History
Date
Name
Owned For
Owner Type
Purchase Details
Closed on
Oct 13, 2022
Sold by
Revs Re Reinvested Llc
Bought by
Fillion Properties Llc
Current Estimated Value
Home Financials for this Owner
Home Financials are based on the most recent Mortgage that was taken out on this home.
Original Mortgage
$428,000
Outstanding Balance
$409,672
Interest Rate
5.66%
Mortgage Type
Purchase Money Mortgage
Estimated Equity
$314,401
Purchase Details
Closed on
Feb 19, 2021
Sold by
Dean Hill Rv Center Llc
Bought by
Revs Re Reinvested Llc
Home Financials for this Owner
Home Financials are based on the most recent Mortgage that was taken out on this home.
Original Mortgage
$134,000
Interest Rate
2.65%
Mortgage Type
Purchase Money Mortgage
Purchase Details
Closed on
Dec 18, 2013
Sold by
Joseph Nancy Ellen
Bought by
Lemay Ronald
Purchase Details
Closed on
Jan 3, 2006
Sold by
Lemieux Raymond A
Bought by
Lemieux Michael and Chicoine Roger
Home Financials for this Owner
Home Financials are based on the most recent Mortgage that was taken out on this home.
Original Mortgage
$250,000
Interest Rate
6.39%
Mortgage Type
Commercial
Create a Home Valuation Report for This Property
The Home Valuation Report is an in-depth analysis detailing your home's value as well as a comparison with similar homes in the area
Home Values in the Area
Average Home Value in this Area
Purchase History
| Date | Buyer | Sale Price | Title Company |
|---|---|---|---|
| Fillion Properties Llc | $535,000 | None Available | |
| Fillion Properties Llc | $535,000 | None Available | |
| Revs Re Reinvested Llc | $225,000 | None Available | |
| Revs Re Reinvested Llc | $225,000 | None Available | |
| Lemay Ronald | $5,000 | -- | |
| Lemieux Michael | $250,000 | -- |
Source: Public Records
Mortgage History
| Date | Status | Borrower | Loan Amount |
|---|---|---|---|
| Open | Fillion Properties Llc | $428,000 | |
| Closed | Fillion Properties Llc | $428,000 | |
| Previous Owner | Revs Re Reinvested Llc | $134,000 | |
| Previous Owner | Lemieux Michael | $250,000 |
Source: Public Records
Tax History Compared to Growth
Tax History
| Year | Tax Paid | Tax Assessment Tax Assessment Total Assessment is a certain percentage of the fair market value that is determined by local assessors to be the total taxable value of land and additions on the property. | Land | Improvement |
|---|---|---|---|---|
| 2024 | $12,857 | $353,600 | $24,400 | $329,200 |
| 2023 | $11,724 | $341,700 | $24,400 | $317,300 |
| 2022 | $10,133 | $314,000 | $24,400 | $289,600 |
| 2021 | $9,926 | $314,000 | $24,400 | $289,600 |
| 2020 | $9,817 | $254,000 | $25,700 | $228,300 |
| 2019 | $9,934 | $254,000 | $25,700 | $228,300 |
| 2017 | $9,271 | $254,000 | $25,700 | $228,300 |
| 2016 | $3,597 | $254,000 | $25,700 | $228,300 |
| 2015 | $7,536 | $234,100 | $27,400 | $206,700 |
| 2014 | $7,372 | $234,100 | $27,400 | $206,700 |
| 2013 | $7,557 | $234,100 | $27,400 | $206,700 |
Source: Public Records
Map
Nearby Homes
- 3910 Claremont Rd
- 3507 Claremont Rd
- 145 Grissom Ln
- 3 Treeline Dr
- 0 Peperes Rd Unit 24.10
- 0 Peperes Rd Unit 93
- 17 Pappas Rd
- 16 Cherry Hill Rd
- 10 Acer Heights Rd
- 8 42nd St
- 62 Ridge Ave
- 550 Nh Rte 11-103
- 2 Birchwood Rd
- 22 Bible Hill Rd
- 37 Maple Ave
- 249 Maple Ave
- 46 Ridge Ave
- 272 Maple Ave
- 278 Pleasant St
- 1254 U S 5
- 3849 Claremont Rd
- 3849 Claremont Rd
- 29 Nash Ln
- 0 Nash Ln Unit 4895997
- 3878 Claremont Rd
- 3691 Claremont Rd
- 0 Morningside Ln Unit 2798005
- 0 Morningside Ln Unit 4816164
- 0 Morningside Ln Unit 4400148
- 0 Morningside Ln Unit 4400147
- 44 Happy Acres Rd
- 52 Happy Acres Rd
- 41 Sandy Ln
- 37 Happy Acres Rd
- 55 Sandy Ln
- 67 Morningside Ln
- 61 Happy Acres Rd
- 12 Cotton Place
- 117 Happy Acres Rd
- 124 Happy Acres Rd