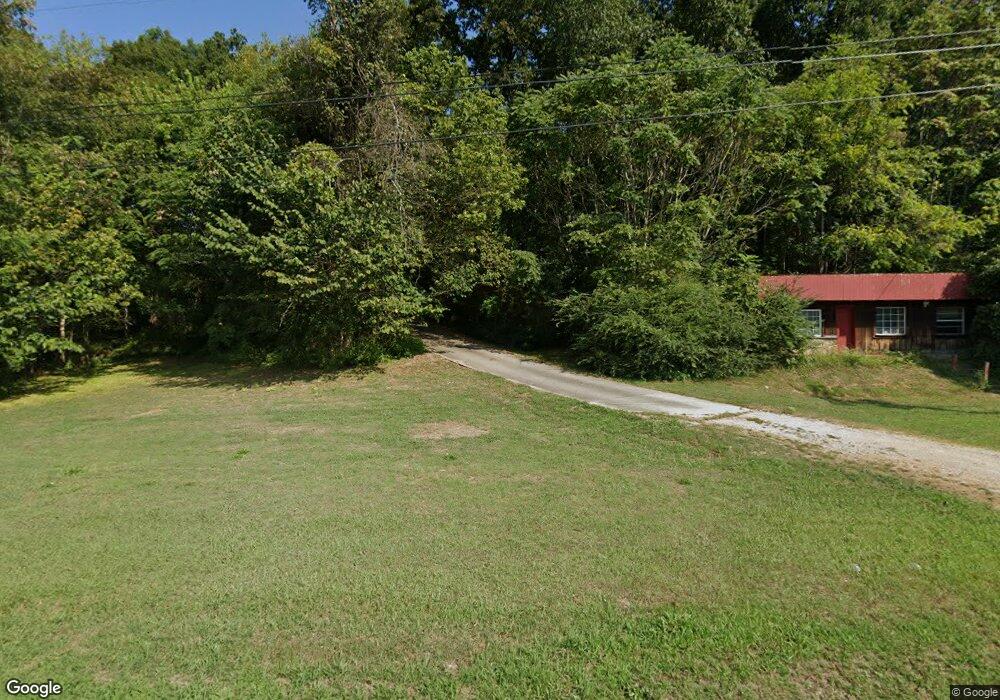
3792 Highway 70 E Cookeville, TN 38506
Estimated Value: $191,000 - $297,000
--
Bed
1
Bath
1,225
Sq Ft
$191/Sq Ft
Est. Value
About This Home
This home is located at 3792 Highway 70 E, Cookeville, TN 38506 and is currently estimated at $234,160, approximately $191 per square foot. 3792 Highway 70 E is a home located in Putnam County with nearby schools including Prescott South Elementary School, Cookeville High School, and Prescott South Middle School.
Ownership History
Date
Name
Owned For
Owner Type
Purchase Details
Closed on
Apr 28, 2025
Sold by
Upchurch Christopher
Bought by
Upchurch Ashley
Current Estimated Value
Home Financials for this Owner
Home Financials are based on the most recent Mortgage that was taken out on this home.
Original Mortgage
$177,650
Outstanding Balance
$177,023
Interest Rate
6.67%
Mortgage Type
New Conventional
Estimated Equity
$57,137
Purchase Details
Closed on
Aug 30, 1999
Sold by
Mcdaniel Larry K
Bought by
Upchurch Christopher B
Purchase Details
Closed on
Jul 20, 1999
Sold by
Mcdaniel Larry K
Bought by
Mcdaniel Larry K
Purchase Details
Closed on
May 20, 1988
Bought by
Mcdaniel Larry
Purchase Details
Closed on
Jun 16, 1975
Bought by
Smith Harold R
Purchase Details
Closed on
Nov 1, 1974
Create a Home Valuation Report for This Property
The Home Valuation Report is an in-depth analysis detailing your home's value as well as a comparison with similar homes in the area
Home Values in the Area
Average Home Value in this Area
Purchase History
| Date | Buyer | Sale Price | Title Company |
|---|---|---|---|
| Upchurch Ashley | $187,000 | Cedar City Title | |
| Upchurch Ashley | $187,000 | Cedar City Title | |
| Upchurch Christopher B | -- | -- | |
| Upchurch Christopher B | $67,690 | -- | |
| Mcdaniel Larry K | -- | -- | |
| Mcdaniel Larry | $29,700 | -- | |
| Smith Harold R | -- | -- | |
| -- | -- | -- |
Source: Public Records
Mortgage History
| Date | Status | Borrower | Loan Amount |
|---|---|---|---|
| Open | Upchurch Ashley | $177,650 | |
| Closed | Upchurch Ashley | $177,650 |
Source: Public Records
Tax History Compared to Growth
Tax History
| Year | Tax Paid | Tax Assessment Tax Assessment Total Assessment is a certain percentage of the fair market value that is determined by local assessors to be the total taxable value of land and additions on the property. | Land | Improvement |
|---|---|---|---|---|
| 2024 | $720 | $27,050 | $8,175 | $18,875 |
| 2023 | $720 | $27,050 | $8,175 | $18,875 |
| 2022 | $669 | $27,050 | $8,175 | $18,875 |
| 2021 | $669 | $27,050 | $8,175 | $18,875 |
| 2020 | $580 | $27,050 | $8,175 | $18,875 |
| 2019 | $580 | $19,825 | $7,325 | $12,500 |
| 2018 | $541 | $19,825 | $7,325 | $12,500 |
| 2017 | $541 | $19,825 | $7,325 | $12,500 |
| 2016 | $541 | $19,825 | $7,325 | $12,500 |
| 2015 | $556 | $19,825 | $7,325 | $12,500 |
| 2014 | $549 | $19,574 | $0 | $0 |
Source: Public Records
Map
Nearby Homes
- 4850 Highway 70 E
- 1940 Karen Cir
- 2396 Highway 70 E
- 3604 Bartlett Dr
- 1561 Edgefield Ct
- 000 Lake Valley Dr
- 00 Lake Valley Dr
- 2233 Hitchcock Dr
- 3382 Dietz Dr
- 2857 Seven Springs Rd
- 3374 Stafford Dr
- 1756 Kirby Ln
- 2375 Hidden Cove Rd
- 4595 Poplar Grove Rd
- 95.43 Sheep Bluff Rd
- 44 acres Sheep Bluff Rd
- 95.43 acre Sheep Bluff Rd
- 0 Sheep Bluff Rd Unit RTC2900265
- 5526 Mount Herman Rd
- 0 Boyd Farris Rd
- 3800 Highway 70 E
- 3812 Highway 70 E
- 4325 J E Bartlett Rd
- 3923 Highway 70 E
- 3597 Highway 70 E
- 3580 Highway 70 E
- 3575 Highway 70 E
- 3940 Highway 70 E
- 4213 Clark Rd
- 3622 Hiriam Brown Rd
- 3622 Hiram Brown Rd
- 3990 Hiram Brown Rd
- 4225 Highway 70 E
- 3404 Highway 70 E
- 3400 Highway 70 E
- 3162 Sparks Dr
- 3158 Sparks Dr
- 4145 Highway 70 E
- 4113 Highway 70 E
- 3159 Sparks Dr