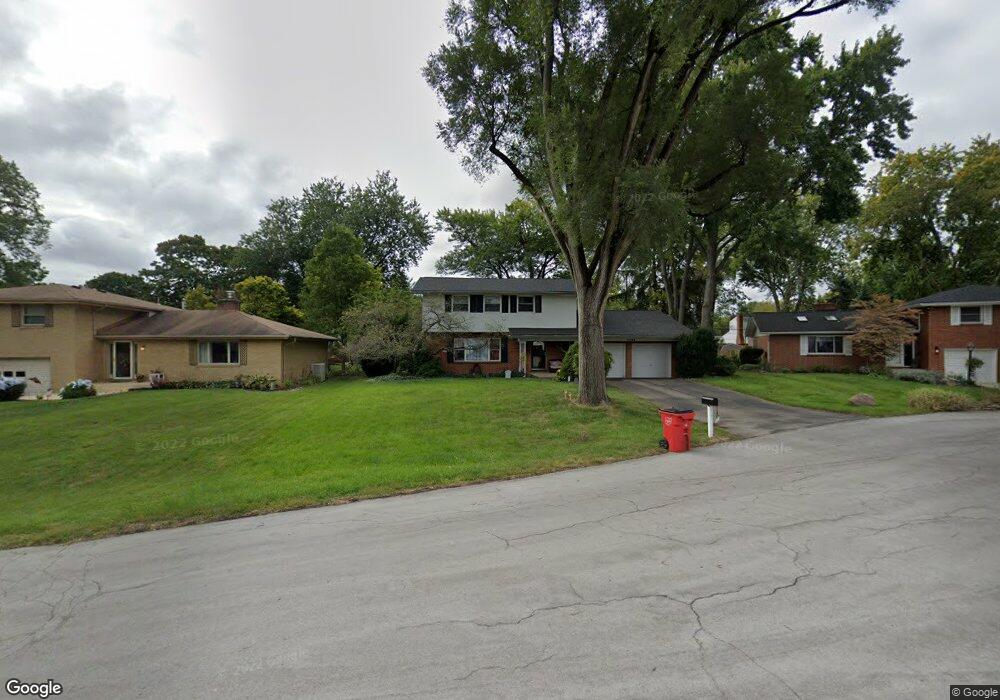
3793 Wenwood Dr Hilliard, OH 43026
Estimated Value: $469,943 - $532,000
4
Beds
3
Baths
2,358
Sq Ft
$209/Sq Ft
Est. Value
About This Home
This home is located at 3793 Wenwood Dr, Hilliard, OH 43026 and is currently estimated at $492,486, approximately $208 per square foot. 3793 Wenwood Dr is a home located in Franklin County with nearby schools including Ridgewood Elementary School, Hilliard Tharp Sixth Grade Elementary School, and Hilliard Weaver Middle School.
Ownership History
Date
Name
Owned For
Owner Type
Purchase Details
Closed on
Jun 18, 2009
Sold by
Dunaj Decorating Inc
Bought by
Cave Gregory J and Cave Kristine J
Current Estimated Value
Home Financials for this Owner
Home Financials are based on the most recent Mortgage that was taken out on this home.
Original Mortgage
$216,000
Outstanding Balance
$137,133
Interest Rate
4.86%
Mortgage Type
Purchase Money Mortgage
Estimated Equity
$355,353
Purchase Details
Closed on
Feb 18, 2009
Sold by
Brock Kevin A and The Merle E Brock Revocable Tr
Bought by
Dunaj Decorating Inc
Purchase Details
Closed on
Feb 2, 2009
Sold by
Estate Of Merle E Brock
Bought by
Brock Kevin A and Merle E Brock Revocable Trust
Purchase Details
Closed on
Nov 14, 1988
Bought by
Brock Merle E
Purchase Details
Closed on
Oct 1, 1981
Create a Home Valuation Report for This Property
The Home Valuation Report is an in-depth analysis detailing your home's value as well as a comparison with similar homes in the area
Home Values in the Area
Average Home Value in this Area
Purchase History
| Date | Buyer | Sale Price | Title Company |
|---|---|---|---|
| Cave Gregory J | $240,000 | Title First | |
| Dunaj Decorating Inc | $135,800 | None Available | |
| Brock Kevin A | -- | None Available | |
| Brock Merle E | -- | -- | |
| -- | $82,000 | -- |
Source: Public Records
Mortgage History
| Date | Status | Borrower | Loan Amount |
|---|---|---|---|
| Open | Cave Gregory J | $216,000 |
Source: Public Records
Tax History Compared to Growth
Tax History
| Year | Tax Paid | Tax Assessment Tax Assessment Total Assessment is a certain percentage of the fair market value that is determined by local assessors to be the total taxable value of land and additions on the property. | Land | Improvement |
|---|---|---|---|---|
| 2024 | $8,375 | $125,060 | $37,770 | $87,290 |
| 2023 | $6,816 | $125,055 | $37,765 | $87,290 |
| 2022 | $7,272 | $105,630 | $35,140 | $70,490 |
| 2021 | $7,268 | $105,630 | $35,140 | $70,490 |
| 2020 | $7,249 | $105,630 | $35,140 | $70,490 |
| 2019 | $7,113 | $87,890 | $29,300 | $58,590 |
| 2018 | $6,799 | $87,890 | $29,300 | $58,590 |
| 2017 | $7,086 | $87,890 | $29,300 | $58,590 |
| 2016 | $6,888 | $78,930 | $16,310 | $62,620 |
| 2015 | $6,509 | $78,930 | $16,310 | $62,620 |
| 2014 | $6,520 | $78,930 | $16,310 | $62,620 |
| 2013 | $3,153 | $75,180 | $15,540 | $59,640 |
Source: Public Records
Map
Nearby Homes
- 3578 Braidwood Dr
- 4664 Cutwater Ln
- 4898 Davidson Run Dr
- 3320 Scioto Run Blvd
- 3894 Maidens Larne Dr
- 4253 Davidson Rd
- 4400 Dublin Rd
- 3873 Tweedsmuir Dr
- 3940 Rennes Dr
- 5049 Dinard Way
- 4025 Dublin Rd
- 3761 Carnforth Dr
- 4270 Llanfair Ct
- 3552 Mountshannon Rd
- 0 Hickory Chase Way
- 4390 Dublin Rd
- 3338 Harbor Bay Dr
- 0 Davidson Rd
- 4473 Addison Ln S
- 4487 Addison Ln S
- 3779 Wenwood Dr
- 3807 Wenwood Dr
- 3776 Ridgewood Dr
- 3767 Wenwood Dr
- 3762 Ridgewood Dr
- 3784 Ridgewood Dr
- 3750 Ridgewood Dr
- 3800 Ridgewood Dr
- 3790 Wenwood Dr
- 3809 Wenwood Dr
- 3808 Wenwood Dr
- 3778 Wenwood Dr
- 3755 Wenwood Dr
- 3766 Wenwood Dr
- 4501 Astral Dr
- 3820 Ridgewood Dr
- 3754 Wenwood Dr
- 3834 Ridgewood Dr
- 3769 Ridgewood Dr
- 3781 Ridgewood Dr