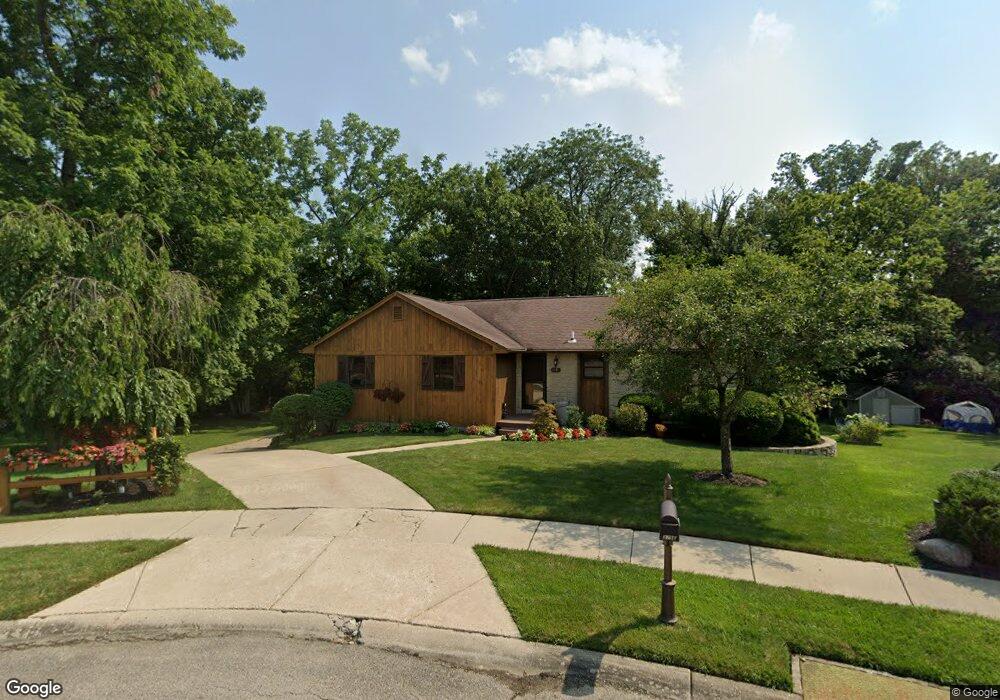
3796 Ripplebrook Place Franklin, OH 45005
Estimated Value: $286,544 - $333,000
3
Beds
2
Baths
1,679
Sq Ft
$181/Sq Ft
Est. Value
About This Home
This home is located at 3796 Ripplebrook Place, Franklin, OH 45005 and is currently estimated at $303,136, approximately $180 per square foot. 3796 Ripplebrook Place is a home located in Warren County with nearby schools including Franklin High School, Marshall High School, and Middletown Christian School.
Ownership History
Date
Name
Owned For
Owner Type
Purchase Details
Closed on
Oct 21, 1985
Sold by
Miller Miller and Miller George A
Bought by
Slone Slone and Slone Ronald S
Current Estimated Value
Purchase Details
Closed on
Dec 26, 1984
Sold by
C. R. Bennett Constructio
Bought by
Miller Miller and Miller George A
Purchase Details
Closed on
Oct 31, 1983
Sold by
Toms & Steven A & Trustee and Warren H.
Bought by
C R Bennett Cons Co
Purchase Details
Closed on
Jul 12, 1982
Sold by
Knollbrook Meadows & Inc
Purchase Details
Closed on
Jan 12, 1981
Sold by
Webb Webb and Webb Burlin C
Purchase Details
Closed on
Jun 7, 1978
Sold by
Knollbrook Meadows Inc
Create a Home Valuation Report for This Property
The Home Valuation Report is an in-depth analysis detailing your home's value as well as a comparison with similar homes in the area
Home Values in the Area
Average Home Value in this Area
Purchase History
| Date | Buyer | Sale Price | Title Company |
|---|---|---|---|
| Slone Slone | $99,500 | -- | |
| Miller Miller | $106,500 | -- | |
| C R Bennett Cons Co | $11,500 | -- | |
| -- | $16,000 | -- | |
| -- | $20,000 | -- | |
| -- | $28,000 | -- |
Source: Public Records
Tax History
| Year | Tax Paid | Tax Assessment Tax Assessment Total Assessment is a certain percentage of the fair market value that is determined by local assessors to be the total taxable value of land and additions on the property. | Land | Improvement |
|---|---|---|---|---|
| 2025 | $3,542 | $88,000 | $14,870 | $73,130 |
| 2024 | $3,542 | $88,000 | $14,870 | $73,130 |
| 2023 | $3,560 | $71,169 | $12,190 | $58,978 |
| 2022 | $3,487 | $71,169 | $12,191 | $58,979 |
| 2021 | $3,297 | $71,169 | $12,191 | $58,979 |
| 2020 | $3,050 | $57,862 | $9,912 | $47,950 |
| 2019 | $2,762 | $57,862 | $9,912 | $47,950 |
| 2018 | $2,675 | $57,862 | $9,912 | $47,950 |
| 2017 | $2,600 | $49,392 | $8,603 | $40,789 |
| 2016 | $2,652 | $49,392 | $8,603 | $40,789 |
| 2015 | $2,654 | $49,392 | $8,603 | $40,789 |
| 2014 | $2,600 | $47,040 | $8,190 | $38,850 |
| 2013 | $2,135 | $56,910 | $9,910 | $47,000 |
Source: Public Records
Map
Nearby Homes
- 3644 Connie Dr
- 4689 Fisher Rd
- 3545 Robinson Vail Rd
- 3412 State Route 122
- 3621 Wilson Farms Blvd
- 5019 Betsy Dr
- 4458 Rose Marie Rd
- 3635 Julie Dr
- 3063 Lynn Dr
- 3481 Darcie Dr
- 5093 Renaissance Park Dr
- 5100 Renaissance Park Dr
- 4640 Shaker Rd
- 3415 Gadwall Ln
- 4650 Shaker Rd
- 5302 Othello Dr
- 5455 Sheldon Close
- 5200 Long Meadow Dr
- 5371 Sheldon Close
- 5220 Long Meadow Dr
- 3800 Ripplebrook Place
- 3799 Ripplebrook Place
- 4307 Harvest Ln
- 4337 Harvest Ln
- 4289 Harvest Ln
- 3777 Knollbrook Dr
- 3775 Knollbrook Dr
- 4352 Todd Rd
- 4353 Harvest Ln
- 4371 Harvest Ln
- 4322 Todd Rd
- 4306 Todd Rd
- 4336 Todd Rd
- 3759 Knollbrook Dr
- 3831 Knollbrook Dr
- 3776 Stable Ct
- 3789 Stable Ct
- 4286 Todd Rd
- 3760 Stable Ct
- 4320 Harvest Ln
Your Personal Tour Guide
Ask me questions while you tour the home.