Estimated Value: $330,000 - $424,000
3
Beds
3
Baths
2,275
Sq Ft
$167/Sq Ft
Est. Value
About This Home
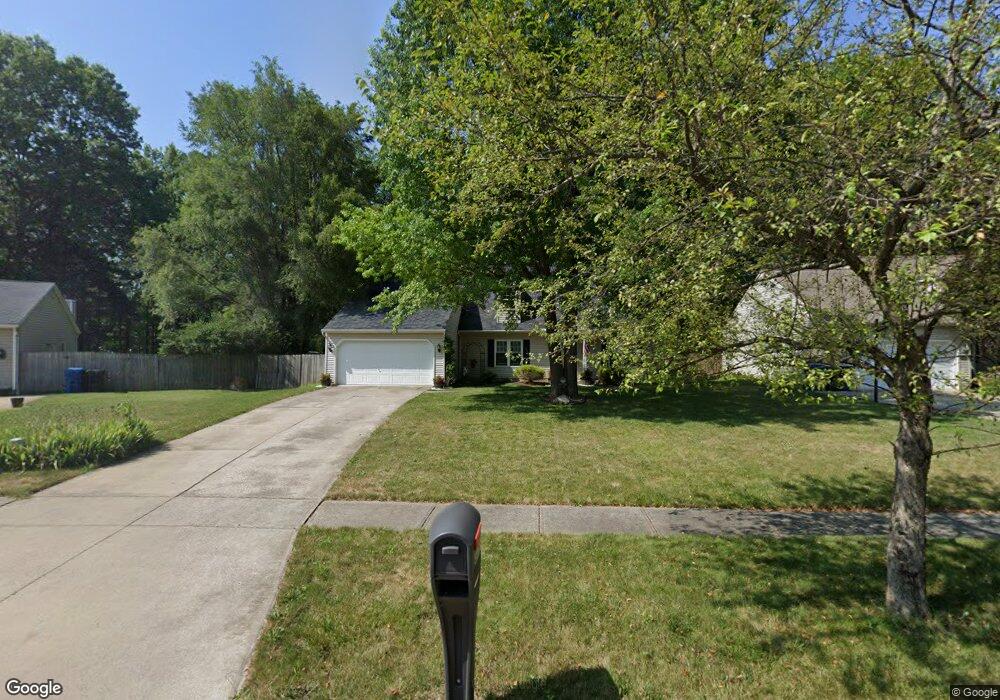
This home is located at 37992 N Doovys St, Avon, OH 44011 and is currently estimated at $380,258, approximately $167 per square foot. 37992 N Doovys St is a home located in Lorain County with nearby schools including Avon Heritage South Elementary School, Avon East Elementary School, and Avon Middle School.
Ownership History
Date
Name
Owned For
Owner Type
Purchase Details
Closed on
Jun 30, 2005
Sold by
Lunato Jason L and Lunato Michelle L
Bought by
Lewis Dwayne E and Lewis Jennifer A
Current Estimated Value
Home Financials for this Owner
Home Financials are based on the most recent Mortgage that was taken out on this home.
Original Mortgage
$207,217
Interest Rate
5.86%
Mortgage Type
FHA
Purchase Details
Closed on
Nov 24, 2004
Sold by
Arndt Ronald F and Arndt Patricia
Bought by
Arndt Ronald F and Arndt Patricia
Purchase Details
Closed on
May 18, 2004
Sold by
Linder Michelle L and Lunato Michelle L
Bought by
Lunato Jason L and Lunato Michelle L
Purchase Details
Closed on
Sep 18, 2001
Sold by
Linder Matthew W
Bought by
Linder Michelle L
Home Financials for this Owner
Home Financials are based on the most recent Mortgage that was taken out on this home.
Original Mortgage
$41,200
Interest Rate
7.06%
Mortgage Type
Stand Alone Second
Create a Home Valuation Report for This Property
The Home Valuation Report is an in-depth analysis detailing your home's value as well as a comparison with similar homes in the area
Home Values in the Area
Average Home Value in this Area
Purchase History
| Date | Buyer | Sale Price | Title Company |
|---|---|---|---|
| Lewis Dwayne E | $214,900 | Executive Title | |
| Arndt Ronald F | -- | -- | |
| Lunato Jason L | -- | -- | |
| Linder Michelle L | -- | First Service Title Agency I |
Source: Public Records
Mortgage History
| Date | Status | Borrower | Loan Amount |
|---|---|---|---|
| Previous Owner | Lewis Dwayne E | $207,217 | |
| Previous Owner | Linder Michelle L | $41,200 |
Source: Public Records
Tax History Compared to Growth
Tax History
| Year | Tax Paid | Tax Assessment Tax Assessment Total Assessment is a certain percentage of the fair market value that is determined by local assessors to be the total taxable value of land and additions on the property. | Land | Improvement |
|---|---|---|---|---|
| 2024 | $4,668 | $92,806 | $20,825 | $71,981 |
| 2023 | $4,279 | $77,354 | $17,553 | $59,801 |
| 2022 | $4,239 | $77,354 | $17,553 | $59,801 |
| 2021 | $4,247 | $77,354 | $17,553 | $59,801 |
| 2020 | $3,791 | $64,790 | $14,700 | $50,090 |
| 2019 | $3,713 | $64,790 | $14,700 | $50,090 |
| 2018 | $3,440 | $64,790 | $14,700 | $50,090 |
| 2017 | $3,204 | $56,210 | $14,360 | $41,850 |
| 2016 | $3,241 | $56,210 | $14,360 | $41,850 |
| 2015 | $3,273 | $56,210 | $14,360 | $41,850 |
| 2014 | $2,990 | $51,780 | $13,230 | $38,550 |
| 2013 | $3,007 | $51,780 | $13,230 | $38,550 |
Source: Public Records
Map
Nearby Homes
- 37865 Lorie Blvd
- 2143 Eaton Dr
- 2409 Quail Hollow
- 1951 Sandalwood Dr
- 2244 Candlewood Dr
- 38756 Renwood Ave
- 38777 Country Club Dr
- 1986 W Reserve Cir Unit 70
- 37745 French Creek Rd
- 1424 Chateau Place
- 39356 Lorreto Ct
- 0 Springfield Dr
- 0 Center Rd Unit 5169281
- 1927 Center Rd
- 3019 Clearbrook Dr
- 3285 Stoney Ridge Rd
- 5401 Hawks Nest Cir
- 3292 Fairview Dr
- 33281 Fairport Dr Unit 60
- 35666 Schneider Ct
- 37976 N Doovys St
- 37956 N Doovys St
- 1810 N Doovys St
- 37993 N Doovys St
- 37936 N Doovys St
- 1810 Doovys St
- 37975 N Doovys St
- 37955 N Doovys St
- 1830 Doovys St
- 37918 N Doovys St
- 37935 N Doovys St
- 1844 N Doovys St
- 1844 Doovys St
- 37898 N Doovys St
- 37917 N Doovys St
- 37976 Caroline Dr
- 37956 Caroline Dr
- 1856 Doovys St
- 37897 N Doovys St
- 37936 Caroline Dr