
Landlord's Agent in 2022
Zohar Zamir
Keller Williams Village Square Realty
(201) 780-7884
212 in this area
670 Total Sales
Estimated Value: $1,077,000 - $1,202,000
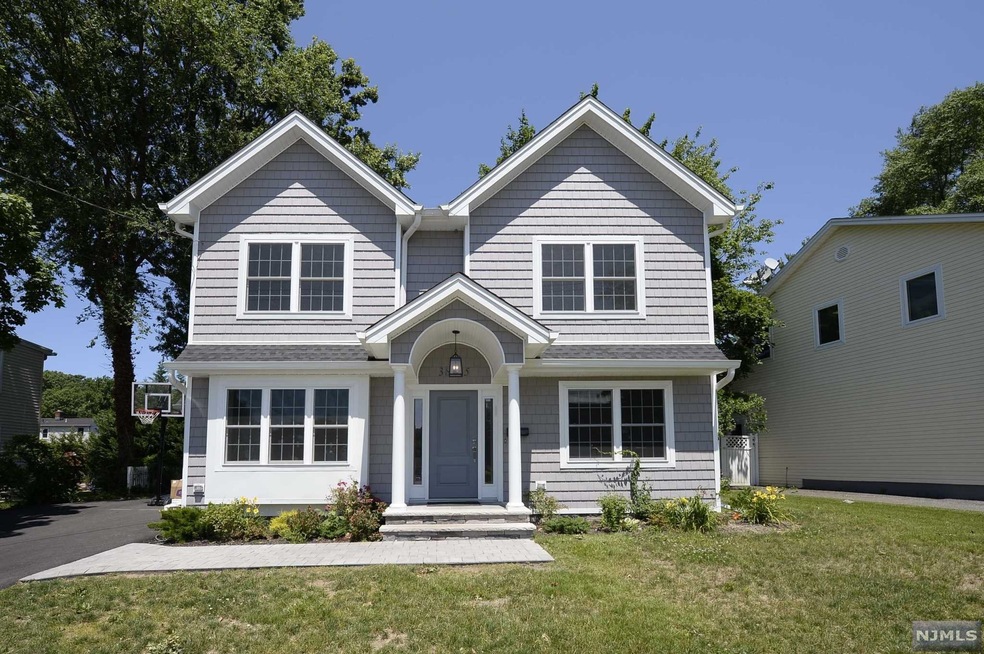
FOR RENT: BEAUTIFULLY MAINTAINED HOME FOR RENT IN FAIR LAWN! BE READY TO HAVE YOUR EXPECTATIONS EXCEEDED, THIS HOME THAT WAS NEWLY BUILT IN 2021, FEATURES HARDWOOD FLOORS, RECESSED LIGHTING, 4 BEDROOMS, 3 FULL BATHROOMS, AN 1 HALF BATHROOM. THE FIRST FLOOR OFFERS A LIVING ROOM, DINING ROOM, A BUTLER'S PANTRY OFF OF THE KITCHEN WITH CUSTOM CABINETS, CAESARSTONE COUNTERTOPS AND CENTER ISLAND THAT OPENS UP TO A FAMILY ROOM. THE SECOND FLOOR OFFERS 3 LARGE SIZED BEDROOMS, A FULL BATHROOM ,LAUNDRY ROOM AND A BEAUTIFUL PRIMARY BEDROOM SUITE WITH PRIMARY BATHROOM AND WALK IN CLOSET, THE BASEMENT IS FULLY FINISHED WITH A FULL BATHROOM! HOME IS PERFECTLY LOCATED MINUTES AWAY FROM TRANSPORTATION TO NYC, ADN STEPS AWAY FROM THE ELEMENTARY AND MIDDLE SCHOOLS, CLOSE TO PARKS, AND SHOPPING!
Last Agent to Rent the Property
Keller Williams Village Square Realty Listed on: 06/24/2022
| Date | Buyer | Sale Price | Title Company |
|---|---|---|---|
| Hamo Itamar Ben | $845,000 | Carnegie Title Llc | |
| 11 Richard Ave Llc | $375,000 | Foundation Ttl Llc Roseland | |
| 11 Richard Ave Llc | $375,000 | Fidelity National Title | |
| Vigna Raymond J | -- | -- | |
| Vigna Raymond J | -- | -- | |
| Vigna Raymond | $35,000 | -- |
| Date | Status | Borrower | Loan Amount |
|---|---|---|---|
| Open | Hamo Itamar Ben | $420,000 | |
| Previous Owner | 11 Richard Ave Llc | $300,000 | |
| Previous Owner | Vigna Raymond J | $117,500 |
| Date | Event | Price | List to Sale | Price per Sq Ft |
|---|---|---|---|---|
| 07/18/2022 07/18/22 | Rented | $5,700 | +3.6% | -- |
| 06/24/2022 06/24/22 | For Rent | $5,500 | -- | -- |
| Year | Tax Paid | Tax Assessment Tax Assessment Total Assessment is a certain percentage of the fair market value that is determined by local assessors to be the total taxable value of land and additions on the property. | Land | Improvement |
|---|---|---|---|---|
| 2025 | $19,136 | $539,200 | $175,000 | $364,200 |
| 2024 | $18,845 | $539,200 | $175,000 | $364,200 |
| 2023 | $18,619 | $539,200 | $175,000 | $364,200 |
| 2022 | $18,619 | $539,200 | $175,000 | $364,200 |
| 2021 | $9,383 | $271,500 | $175,000 | $96,500 |
| 2020 | $9,312 | $271,500 | $175,000 | $96,500 |
| 2019 | $9,150 | $271,500 | $175,000 | $96,500 |
| 2018 | $8,981 | $271,500 | $175,000 | $96,500 |
| 2017 | $8,759 | $271,500 | $175,000 | $96,500 |
| 2016 | $8,517 | $271,500 | $175,000 | $96,500 |
| 2015 | $8,357 | $271,500 | $175,000 | $96,500 |
| 2014 | $8,216 | $271,500 | $175,000 | $96,500 |
Landlord's Agent in 2022
Zohar Zamir
Keller Williams Village Square Realty
(201) 780-7884
212 in this area
670 Total Sales
Tenant's Agent in 2022
Norma Bonilla
Prominent Properties Sotheby's International Realty-Tenafly
(201) 647-3603
90 Total Sales
Source: New Jersey MLS
MLS Number: 22023497
APN: 17-02516-0000-00006
Disclaimer: Certain information contained herein is derived from information provided by parties other than Homes.com. All information provided is deemed reliable, but is not guaranteed to be accurate and should be independently verified.
![]() The data relating to the real estate for sale on this web site comes in part from the Internet Data Exchange Program of the NJMLS. Real estate listings held by brokerage firms other than Ten-X are marked with the Internet Data Exchange logo and information about them includes the name of the listing brokers. Some properties listed with the participating brokers do not appear on this website at the request of the seller. Listings of brokers that do not participate in Internet Data Exchange do not appear on this website.
The data relating to the real estate for sale on this web site comes in part from the Internet Data Exchange Program of the NJMLS. Real estate listings held by brokerage firms other than Ten-X are marked with the Internet Data Exchange logo and information about them includes the name of the listing brokers. Some properties listed with the participating brokers do not appear on this website at the request of the seller. Listings of brokers that do not participate in Internet Data Exchange do not appear on this website.
All information deemed reliable but not guaranteed. Source: New Jersey Multiple Listing, Inc.
© 2025 New Jersey Multiple Listing Service Inc. All rights reserved.