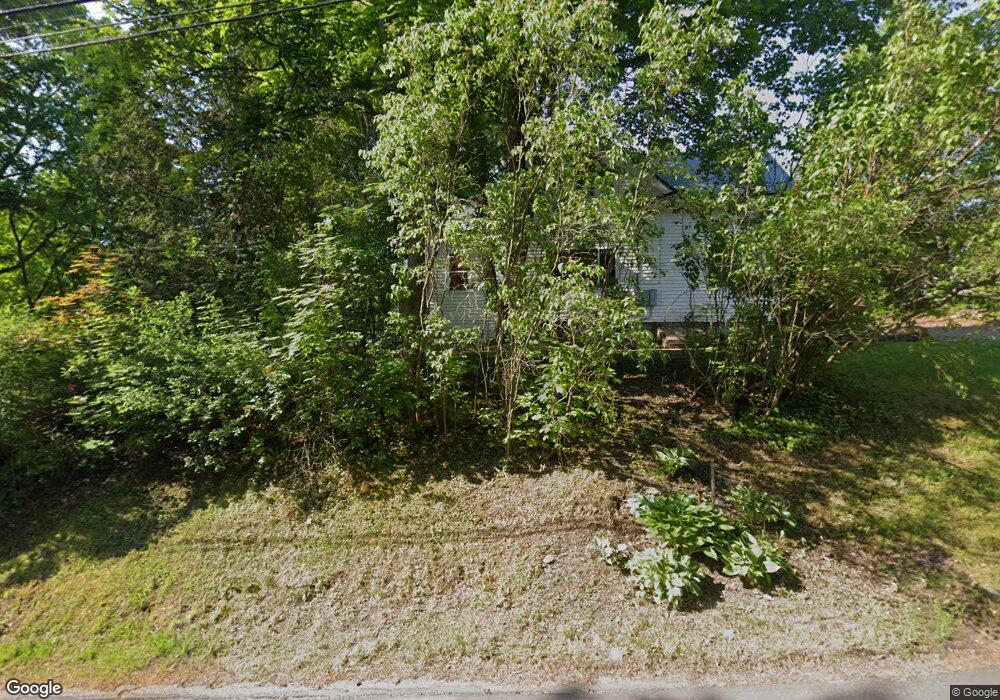
38 Academy St Hallowell, ME 04347
Estimated Value: $395,559 - $499,000
6
Beds
2
Baths
2,630
Sq Ft
$166/Sq Ft
Est. Value
About This Home
This home is located at 38 Academy St, Hallowell, ME 04347 and is currently estimated at $437,390, approximately $166 per square foot. 38 Academy St is a home located in Kennebec County with nearby schools including Hall-Dale Elementary School, Dresden Elementary School, and Marcia Buker School.
Ownership History
Date
Name
Owned For
Owner Type
Purchase Details
Closed on
Aug 13, 2009
Sold by
Carey James P and Carey Tina M
Bought by
Carey James P and Carey Tina M
Current Estimated Value
Home Financials for this Owner
Home Financials are based on the most recent Mortgage that was taken out on this home.
Original Mortgage
$115,500
Interest Rate
5.36%
Mortgage Type
Purchase Money Mortgage
Create a Home Valuation Report for This Property
The Home Valuation Report is an in-depth analysis detailing your home's value as well as a comparison with similar homes in the area
Home Values in the Area
Average Home Value in this Area
Purchase History
| Date | Buyer | Sale Price | Title Company |
|---|---|---|---|
| Carey James P | -- | -- |
Source: Public Records
Mortgage History
| Date | Status | Borrower | Loan Amount |
|---|---|---|---|
| Closed | Carey James P | $115,500 |
Source: Public Records
Tax History Compared to Growth
Tax History
| Year | Tax Paid | Tax Assessment Tax Assessment Total Assessment is a certain percentage of the fair market value that is determined by local assessors to be the total taxable value of land and additions on the property. | Land | Improvement |
|---|---|---|---|---|
| 2024 | $4,312 | $216,700 | $83,900 | $132,800 |
| 2023 | $3,635 | $157,700 | $61,100 | $96,600 |
| 2022 | $3,501 | $157,700 | $61,100 | $96,600 |
| 2021 | $3,359 | $157,700 | $61,100 | $96,600 |
| 2020 | $3,391 | $157,700 | $61,100 | $96,600 |
| 2019 | $4,245 | $157,700 | $61,100 | $96,600 |
| 2018 | $3,729 | $152,000 | $61,100 | $90,900 |
| 2017 | $1,051 | $149,000 | $61,100 | $87,900 |
| 2016 | $761 | $114,000 | $61,100 | $52,900 |
| 2015 | $2,006 | $114,000 | $61,100 | $52,900 |
| 2014 | $2,006 | $114,000 | $61,100 | $52,900 |
| 2013 | $1,949 | $114,000 | $61,100 | $52,900 |
Source: Public Records
Map
Nearby Homes
- 64 Central St
- 4 Mayflower Rd
- 10 Warren St
- 15 Middle St Unit 3
- 17 Union St
- 31 Oakwood Dr
- 24 High St
- 42 Winthrop St
- 228 Water St
- 85 Middle St Unit 10
- 0 Winthrop Street Map 6 Lot 15
- 68 Mayflower Rd
- 17 Beech St Unit 17
- 39 Water St
- Lot 20 Acorn Ln Unit 20
- Lot 23 Acorn Ln Unit 23
- Lot 21 Acorn Ln Unit 21
- 0 Winthrop St Unit 1633734
- 6 Stoddard Ln
- 0 Carriage Ln