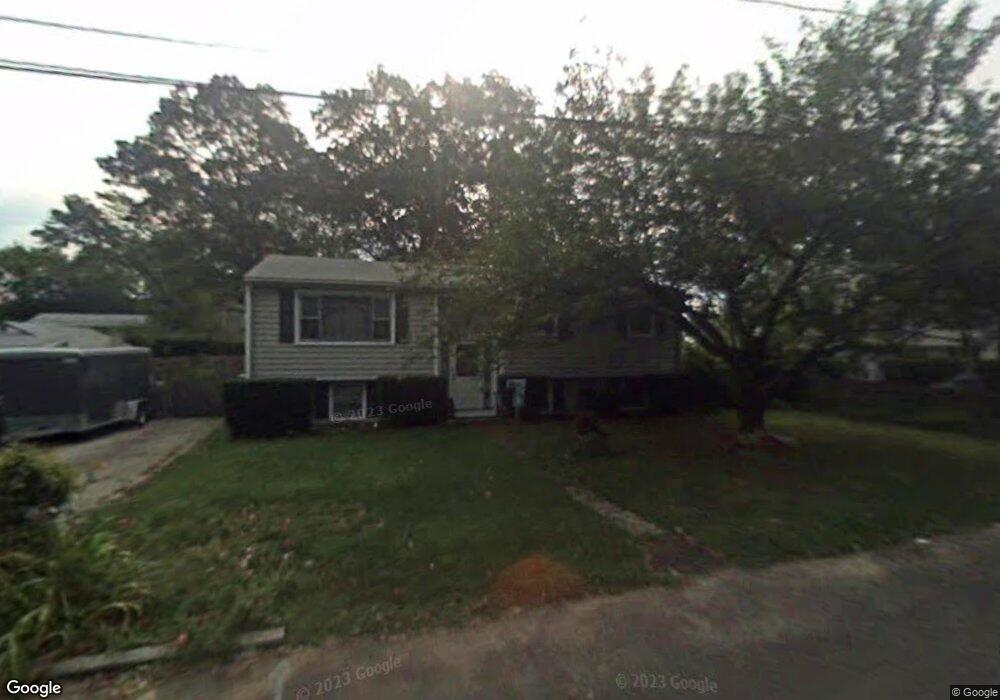
38 Allen Ave Warwick, RI 02889
Long Meadow NeighborhoodEstimated Value: $377,860 - $452,000
4
Beds
2
Baths
1,918
Sq Ft
$216/Sq Ft
Est. Value
About This Home
This home is located at 38 Allen Ave, Warwick, RI 02889 and is currently estimated at $414,715, approximately $216 per square foot. 38 Allen Ave is a home located in Kent County with nearby schools including Saint Kevin School and Bishop Hendricken High School.
Ownership History
Date
Name
Owned For
Owner Type
Purchase Details
Closed on
May 9, 2025
Sold by
Lenihan James B and Tobey Wanda J
Bought by
Lenihan Fret and Lenihan L
Current Estimated Value
Purchase Details
Closed on
Aug 15, 2023
Sold by
Lenihan James B
Bought by
Lenihan James B and Tobey Wanda J
Create a Home Valuation Report for This Property
The Home Valuation Report is an in-depth analysis detailing your home's value as well as a comparison with similar homes in the area
Home Values in the Area
Average Home Value in this Area
Purchase History
| Date | Buyer | Sale Price | Title Company |
|---|---|---|---|
| Lenihan Fret | -- | None Available | |
| Lenihan Fret | -- | None Available | |
| Lenihan James B | -- | None Available | |
| Lenihan James B | -- | None Available |
Source: Public Records
Tax History
| Year | Tax Paid | Tax Assessment Tax Assessment Total Assessment is a certain percentage of the fair market value that is determined by local assessors to be the total taxable value of land and additions on the property. | Land | Improvement |
|---|---|---|---|---|
| 2025 | $4,761 | $374,900 | $113,100 | $261,800 |
| 2024 | $4,290 | $296,500 | $98,300 | $198,200 |
| 2023 | $4,207 | $296,500 | $98,300 | $198,200 |
| 2022 | $3,956 | $211,200 | $61,500 | $149,700 |
| 2021 | $3,956 | $211,200 | $61,500 | $149,700 |
| 2020 | $3,956 | $211,200 | $61,500 | $149,700 |
| 2019 | $3,956 | $211,200 | $61,500 | $149,700 |
| 2018 | $3,798 | $182,600 | $61,500 | $121,100 |
| 2017 | $3,696 | $182,600 | $61,500 | $121,100 |
| 2016 | $3,696 | $182,600 | $61,500 | $121,100 |
| 2015 | $3,445 | $166,000 | $55,400 | $110,600 |
| 2014 | $3,330 | $166,000 | $55,400 | $110,600 |
| 2013 | $3,285 | $166,000 | $55,400 | $110,600 |
Source: Public Records
Map
Nearby Homes
- 39 Damon Ave
- 11 Heights Ave
- 46 Verndale St
- 17 Ardway Ave
- 355 Church Ave
- 2 Overbrook Ave
- 17 Wuddall Ave
- 103 Brightside Ave
- 19 Beatrice Ave
- 404 Church Ave
- 37 Fulton St
- 14 Beatrice Ave
- 150 Mill Cove Rd
- 276 Tidewater Dr
- 35 Transit St
- 266 Vineyard Rd
- 101 Farmland Rd
- 15 Center Ct
- 59 Recess Ln
- 112 Old Warwick Ave
Your Personal Tour Guide
Ask me questions while you tour the home.