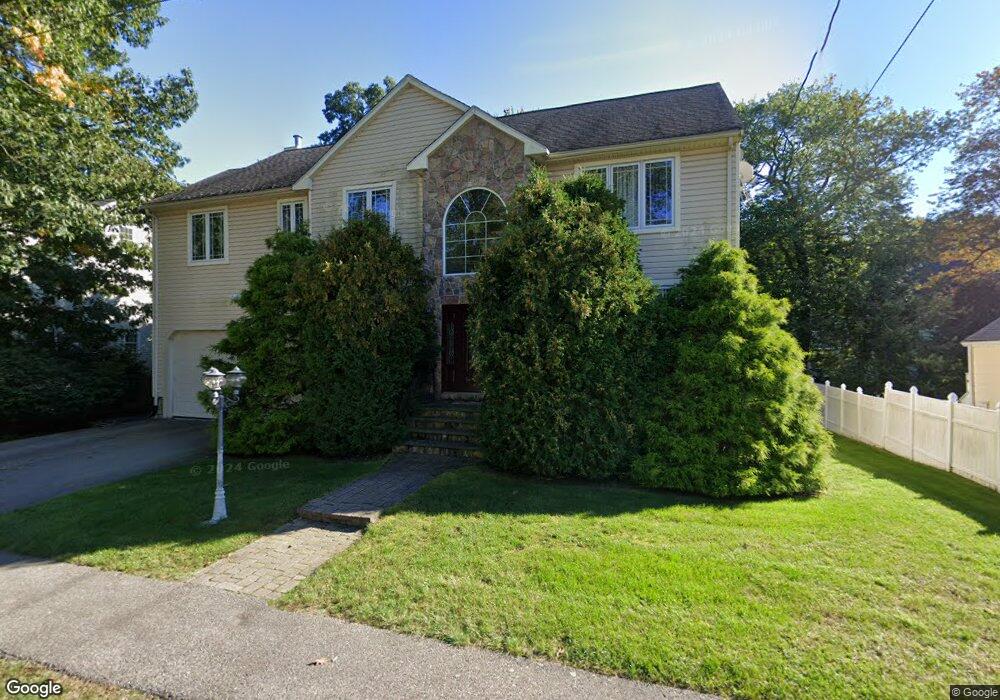
38 Arch St Needham, MA 02492
Estimated Value: $1,296,000 - $2,317,000
4
Beds
4
Baths
1,520
Sq Ft
$1,222/Sq Ft
Est. Value
About This Home
This home is located at 38 Arch St, Needham, MA 02492 and is currently estimated at $1,857,229, approximately $1,221 per square foot. 38 Arch St is a home located in Norfolk County with nearby schools including Mitchell Elementary School, High Rock Middle School, and Pollard Middle School.
Ownership History
Date
Name
Owned For
Owner Type
Purchase Details
Closed on
Apr 6, 2004
Sold by
Blanchard Rosemarie
Bought by
Avrutskaya Irina and Avrutskiy Stanislav
Current Estimated Value
Home Financials for this Owner
Home Financials are based on the most recent Mortgage that was taken out on this home.
Original Mortgage
$410,000
Outstanding Balance
$191,594
Interest Rate
5.56%
Estimated Equity
$1,665,635
Purchase Details
Closed on
Sep 4, 2002
Sold by
State St B&T Co
Bought by
Avrutsky Stanislav and Avrutsky Irina
Home Financials for this Owner
Home Financials are based on the most recent Mortgage that was taken out on this home.
Original Mortgage
$382,500
Interest Rate
6.39%
Mortgage Type
Purchase Money Mortgage
Create a Home Valuation Report for This Property
The Home Valuation Report is an in-depth analysis detailing your home's value as well as a comparison with similar homes in the area
Home Values in the Area
Average Home Value in this Area
Purchase History
| Date | Buyer | Sale Price | Title Company |
|---|---|---|---|
| Avrutskaya Irina | -- | -- | |
| Blanchard Rosemarie | -- | -- | |
| Avrutsky Stanislav | $425,000 | -- |
Source: Public Records
Mortgage History
| Date | Status | Borrower | Loan Amount |
|---|---|---|---|
| Open | Avrutskaya Irina | $410,000 | |
| Previous Owner | Avrutsky Stanislav | $382,500 |
Source: Public Records
Tax History
| Year | Tax Paid | Tax Assessment Tax Assessment Total Assessment is a certain percentage of the fair market value that is determined by local assessors to be the total taxable value of land and additions on the property. | Land | Improvement |
|---|---|---|---|---|
| 2025 | $16,678 | $1,573,400 | $786,500 | $786,900 |
| 2024 | $17,832 | $1,424,300 | $579,000 | $845,300 |
| 2023 | $17,714 | $1,358,400 | $579,000 | $779,400 |
| 2022 | $16,715 | $1,250,200 | $512,400 | $737,800 |
| 2021 | $16,290 | $1,250,200 | $512,400 | $737,800 |
| 2020 | $15,896 | $1,272,700 | $512,600 | $760,100 |
| 2019 | $15,058 | $1,215,300 | $466,000 | $749,300 |
| 2018 | $14,438 | $1,215,300 | $466,000 | $749,300 |
| 2017 | $13,266 | $1,115,700 | $466,000 | $649,700 |
| 2016 | $12,954 | $1,122,500 | $466,000 | $656,500 |
| 2015 | $12,673 | $1,122,500 | $466,000 | $656,500 |
| 2014 | $11,845 | $1,017,600 | $388,300 | $629,300 |
Source: Public Records
Map
Nearby Homes
- 176 Highgate St
- 68 Brookline St
- 190 Brookline St
- 31 Birds Hill Ave
- 17 Lindbergh Ave
- 36 Otis St Unit 36
- 638 Webster St
- 638 Webster St Unit 638
- 126 Prince St
- 883 Greendale Ave
- 510 Webster St
- 100 Bradford St
- 60 Douglas Rd
- 28 Green St
- 19 Oakland Ave Unit 19
- 24 Mellen St
- 19 Highland Ct Unit 19
- 143 Hunting Rd
- 58 Morton St
- 7 West St
Your Personal Tour Guide
Ask me questions while you tour the home.