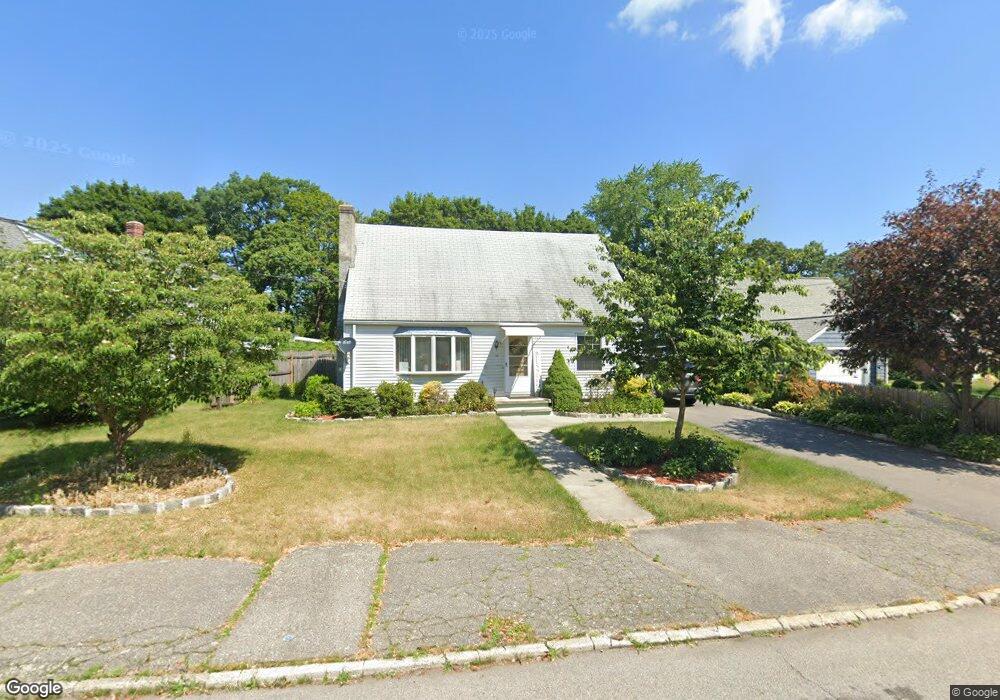
38 Arland Dr Pawtucket, RI 02861
Darlington NeighborhoodEstimated Value: $408,000 - $522,000
3
Beds
1
Bath
2,358
Sq Ft
$187/Sq Ft
Est. Value
About This Home
This home is located at 38 Arland Dr, Pawtucket, RI 02861 and is currently estimated at $441,503, approximately $187 per square foot. 38 Arland Dr is a home located in Providence County with nearby schools including St Cecilia School and Dayspring Christian Academy.
Ownership History
Date
Name
Owned For
Owner Type
Purchase Details
Closed on
Jun 30, 2006
Sold by
Humphrey Elmer
Bought by
Vasquez-Godoy Jose E
Current Estimated Value
Home Financials for this Owner
Home Financials are based on the most recent Mortgage that was taken out on this home.
Original Mortgage
$120,000
Interest Rate
6.58%
Mortgage Type
Purchase Money Mortgage
Purchase Details
Closed on
Oct 1, 1998
Sold by
Harvey Kim Stanley and Harvey Nancy
Bought by
Humphrey Elmer and Humphrey Donna
Purchase Details
Closed on
Mar 24, 1989
Sold by
Force Craig S
Bought by
Harvey Kim Stanley
Create a Home Valuation Report for This Property
The Home Valuation Report is an in-depth analysis detailing your home's value as well as a comparison with similar homes in the area
Home Values in the Area
Average Home Value in this Area
Purchase History
| Date | Buyer | Sale Price | Title Company |
|---|---|---|---|
| Vasquez-Godoy Jose E | $232,000 | -- | |
| Humphrey Elmer | $113,000 | -- | |
| Harvey Kim Stanley | $126,000 | -- |
Source: Public Records
Mortgage History
| Date | Status | Borrower | Loan Amount |
|---|---|---|---|
| Closed | Harvey Kim Stanley | $98,000 | |
| Closed | Harvey Kim Stanley | $112,000 | |
| Closed | Harvey Kim Stanley | $120,000 |
Source: Public Records
Tax History
| Year | Tax Paid | Tax Assessment Tax Assessment Total Assessment is a certain percentage of the fair market value that is determined by local assessors to be the total taxable value of land and additions on the property. | Land | Improvement |
|---|---|---|---|---|
| 2025 | $4,362 | $331,700 | $154,800 | $176,900 |
| 2024 | $4,093 | $331,700 | $154,800 | $176,900 |
| 2023 | $3,939 | $232,500 | $84,400 | $148,100 |
| 2022 | $3,855 | $232,500 | $84,400 | $148,100 |
| 2021 | $3,855 | $232,500 | $84,400 | $148,100 |
| 2020 | $4,145 | $198,400 | $87,900 | $110,500 |
| 2019 | $4,145 | $198,400 | $87,900 | $110,500 |
| 2018 | $3,994 | $198,400 | $87,900 | $110,500 |
| 2017 | $4,342 | $191,100 | $90,300 | $100,800 |
| 2016 | $4,183 | $191,100 | $90,300 | $100,800 |
| 2015 | $4,183 | $191,100 | $90,300 | $100,800 |
| 2014 | $3,851 | $167,000 | $77,800 | $89,200 |
Source: Public Records
Map
Nearby Homes
Your Personal Tour Guide
Ask me questions while you tour the home.