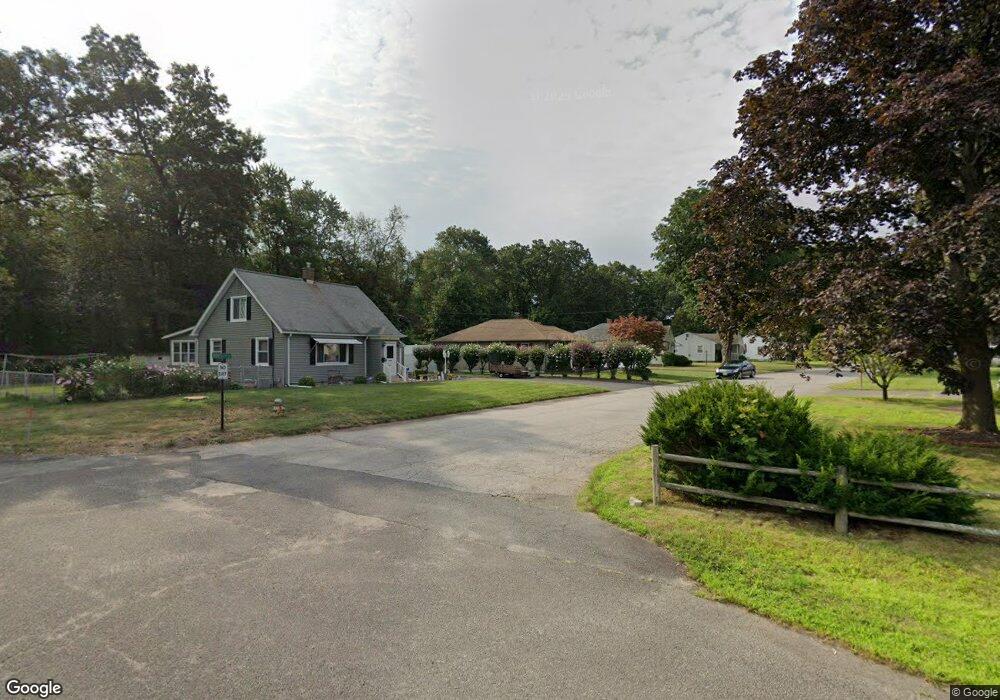
38 Barrett St Ludlow, MA 01056
Estimated Value: $283,000 - $293,000
2
Beds
1
Bath
988
Sq Ft
$292/Sq Ft
Est. Value
About This Home
This home is located at 38 Barrett St, Ludlow, MA 01056 and is currently estimated at $288,317, approximately $291 per square foot. 38 Barrett St is a home located in Hampden County with nearby schools including East Street Elementary School, Chapin Street Elementary School, and Paul R. Baird Middle School.
Ownership History
Date
Name
Owned For
Owner Type
Purchase Details
Closed on
Dec 27, 2002
Sold by
Rosa Luis M and Rosa Ilda R
Bought by
Tereso Paul J
Current Estimated Value
Home Financials for this Owner
Home Financials are based on the most recent Mortgage that was taken out on this home.
Original Mortgage
$101,600
Outstanding Balance
$42,556
Interest Rate
6.02%
Mortgage Type
Purchase Money Mortgage
Estimated Equity
$245,761
Purchase Details
Closed on
Jun 25, 1992
Sold by
Clogston Patricia
Bought by
Rosa Luis M and Ramos Ilda S
Home Financials for this Owner
Home Financials are based on the most recent Mortgage that was taken out on this home.
Original Mortgage
$86,450
Interest Rate
8.57%
Mortgage Type
Purchase Money Mortgage
Create a Home Valuation Report for This Property
The Home Valuation Report is an in-depth analysis detailing your home's value as well as a comparison with similar homes in the area
Home Values in the Area
Average Home Value in this Area
Purchase History
| Date | Buyer | Sale Price | Title Company |
|---|---|---|---|
| Tereso Paul J | $127,000 | -- | |
| Tereso Paul J | $127,000 | -- | |
| Rosa Luis M | $87,000 | -- | |
| Rosa Luis M | $87,000 | -- |
Source: Public Records
Mortgage History
| Date | Status | Borrower | Loan Amount |
|---|---|---|---|
| Open | Tereso Paul J | $101,600 | |
| Closed | Rosa Luis M | $101,600 | |
| Previous Owner | Rosa Luis M | $8,000 | |
| Previous Owner | Rosa Luis M | $85,150 | |
| Previous Owner | Rosa Luis M | $86,450 |
Source: Public Records
Tax History
| Year | Tax Paid | Tax Assessment Tax Assessment Total Assessment is a certain percentage of the fair market value that is determined by local assessors to be the total taxable value of land and additions on the property. | Land | Improvement |
|---|---|---|---|---|
| 2025 | $3,992 | $230,100 | $72,000 | $158,100 |
| 2024 | $3,844 | $212,500 | $72,000 | $140,500 |
| 2023 | $3,617 | $185,400 | $63,200 | $122,200 |
| 2022 | $3,460 | $173,100 | $63,200 | $109,900 |
| 2021 | $3,482 | $165,200 | $63,200 | $102,000 |
| 2020 | $3,334 | $161,700 | $62,200 | $99,500 |
| 2019 | $3,090 | $155,900 | $61,600 | $94,300 |
| 2018 | $2,903 | $152,700 | $61,600 | $91,100 |
| 2017 | $2,805 | $151,400 | $59,800 | $91,600 |
| 2016 | $2,642 | $145,700 | $58,600 | $87,100 |
| 2015 | $2,479 | $143,400 | $58,000 | $85,400 |
Source: Public Records
Map
Nearby Homes
- 162 Highland Ave
- 70 Fuller St
- 0 Fuller St Unit 73409741
- 26 Swan Ave
- 31 Greenwich St
- 59 Prospect St
- 42 Loopley St
- 119 Blisswood Village Dr
- 39 Rogers Ave
- 102 Swan Ave
- 287 East St
- 374 East St
- 0 Center St Unit 73415933
- 45 Canterbury St
- 84 Chapin Greene Dr
- 57 Belmont St
- 37 Franklin St
- 12 Weston St
- 70 Sroka Ln
- 4-6 Dalton St
Your Personal Tour Guide
Ask me questions while you tour the home.