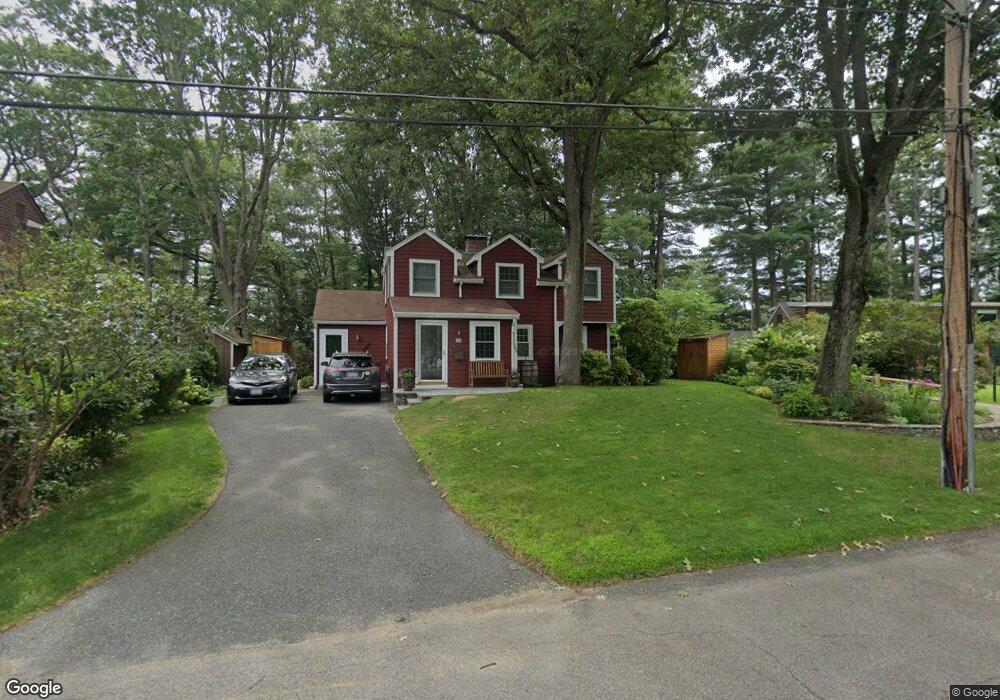
38 Bay View Rd Wellesley, MA 02482
Estimated Value: $1,081,000 - $1,711,000
3
Beds
3
Baths
1,790
Sq Ft
$809/Sq Ft
Est. Value
About This Home
This home is located at 38 Bay View Rd, Wellesley, MA 02482 and is currently estimated at $1,448,155, approximately $809 per square foot. 38 Bay View Rd is a home located in Norfolk County with nearby schools including John D. Hardy Elementary School, Wellesley Middle School, and Wellesley Sr High School.
Ownership History
Date
Name
Owned For
Owner Type
Purchase Details
Closed on
Sep 3, 2021
Sold by
Hodge Thomas P and Johnson Caroline
Bought by
T Peter Hodge 2021 Ret
Current Estimated Value
Purchase Details
Closed on
Jan 17, 1996
Sold by
Blotner Pamela W
Bought by
Hodge Thomas P
Home Financials for this Owner
Home Financials are based on the most recent Mortgage that was taken out on this home.
Original Mortgage
$150,000
Interest Rate
7.16%
Mortgage Type
Purchase Money Mortgage
Purchase Details
Closed on
Sep 24, 1992
Sold by
Dake Perrin W and Dake Estelle L
Bought by
Blotner Pamela W
Home Financials for this Owner
Home Financials are based on the most recent Mortgage that was taken out on this home.
Original Mortgage
$200,000
Interest Rate
7.9%
Mortgage Type
Purchase Money Mortgage
Create a Home Valuation Report for This Property
The Home Valuation Report is an in-depth analysis detailing your home's value as well as a comparison with similar homes in the area
Purchase History
| Date | Buyer | Sale Price | Title Company |
|---|---|---|---|
| T Peter Hodge 2021 Ret | -- | None Available | |
| Hodge Thomas P | $290,000 | -- | |
| Blotner Pamela W | $260,000 | -- |
Source: Public Records
Mortgage History
| Date | Status | Borrower | Loan Amount |
|---|---|---|---|
| Previous Owner | Blotner Pamela W | $120,000 | |
| Previous Owner | Blotner Pamela W | $150,000 | |
| Previous Owner | Blotner Pamela W | $200,000 |
Source: Public Records
Tax History
| Year | Tax Paid | Tax Assessment Tax Assessment Total Assessment is a certain percentage of the fair market value that is determined by local assessors to be the total taxable value of land and additions on the property. | Land | Improvement |
|---|---|---|---|---|
| 2025 | $13,837 | $1,346,000 | $1,024,000 | $322,000 |
| 2024 | $12,919 | $1,241,000 | $931,000 | $310,000 |
| 2023 | $12,263 | $1,071,000 | $825,000 | $246,000 |
| 2022 | $12,147 | $1,040,000 | $709,000 | $331,000 |
| 2021 | $11,856 | $1,009,000 | $678,000 | $331,000 |
| 2020 | $11,664 | $1,009,000 | $678,000 | $331,000 |
| 2019 | $11,315 | $978,000 | $647,000 | $331,000 |
| 2018 | $10,516 | $880,000 | $629,000 | $251,000 |
| 2017 | $10,387 | $881,000 | $630,000 | $251,000 |
| 2016 | $10,174 | $860,000 | $619,000 | $241,000 |
| 2015 | $10,959 | $948,000 | $707,000 | $241,000 |
Source: Public Records
Map
Nearby Homes
- 36 Bay View Rd
- 42 Bay View Rd
- 34 Bay View Rd
- 34 Bay View Rd Unit 1
- 44 Bay View Rd
- 30 Bay View Rd
- 35 Bay View Rd
- 39 Bay View Rd
- 41 Bay View Rd
- 33 Bay View Rd
- 29 Bay View Rd
- 28 Bay View Rd
- 45 Bay View Rd
- 23 Shadow Ln
- 24 Bay View Rd
- 49 Russell Rd
- 24 Shadow Ln
- 21 Shadow Ln
- 20 Bay View Rd
- 2 Dale St Unit 1
Your Personal Tour Guide
Ask me questions while you tour the home.