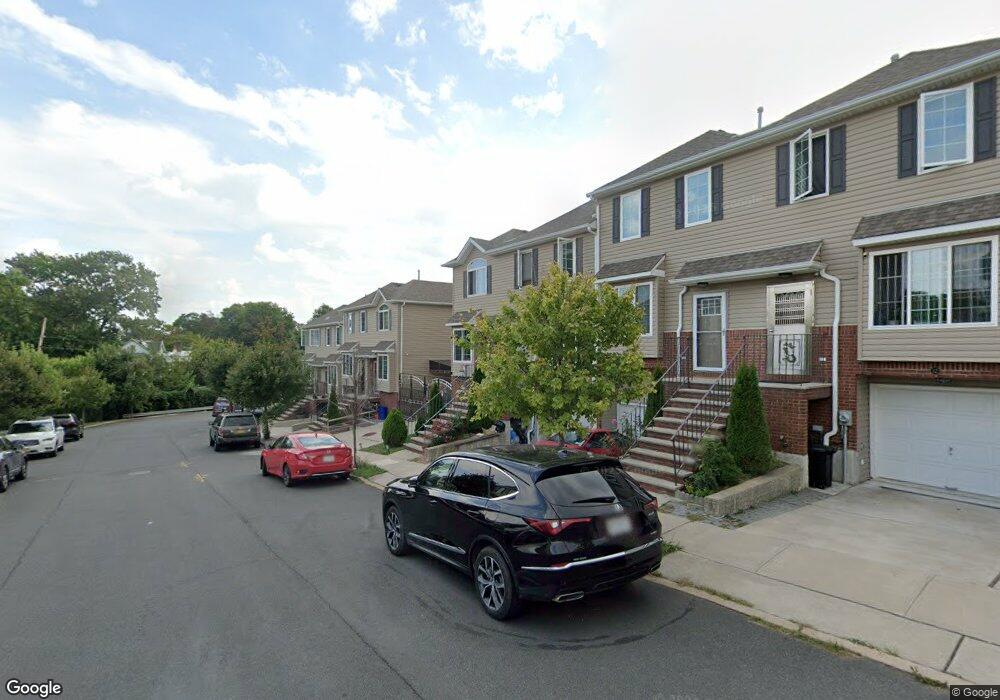
38 Burgundy Loop Staten Island, NY 10304
Clifton NeighborhoodEstimated Value: $655,000 - $858,000
3
Beds
3
Baths
1,600
Sq Ft
$459/Sq Ft
Est. Value
About This Home
This home is located at 38 Burgundy Loop, Staten Island, NY 10304 and is currently estimated at $734,135, approximately $458 per square foot. 38 Burgundy Loop is a home located in Richmond County with nearby schools including Ps 13 M L Lindenmeyer, I.S. 49 Berta A Dreyfus, and New Dorp High School.
Ownership History
Date
Name
Owned For
Owner Type
Purchase Details
Closed on
Jul 27, 2016
Sold by
Baiano Development Llc
Bought by
Yang Farong
Current Estimated Value
Home Financials for this Owner
Home Financials are based on the most recent Mortgage that was taken out on this home.
Original Mortgage
$200,000
Outstanding Balance
$163,422
Interest Rate
4.25%
Mortgage Type
Adjustable Rate Mortgage/ARM
Estimated Equity
$570,713
Create a Home Valuation Report for This Property
The Home Valuation Report is an in-depth analysis detailing your home's value as well as a comparison with similar homes in the area
Home Values in the Area
Average Home Value in this Area
Purchase History
| Date | Buyer | Sale Price | Title Company |
|---|---|---|---|
| Yang Farong | $405,498 | The Security Title Guarantee |
Source: Public Records
Mortgage History
| Date | Status | Borrower | Loan Amount |
|---|---|---|---|
| Open | Yang Farong | $200,000 |
Source: Public Records
Tax History Compared to Growth
Tax History
| Year | Tax Paid | Tax Assessment Tax Assessment Total Assessment is a certain percentage of the fair market value that is determined by local assessors to be the total taxable value of land and additions on the property. | Land | Improvement |
|---|---|---|---|---|
| 2025 | $5,784 | $46,500 | $3,388 | $43,112 |
| 2024 | $5,784 | $39,720 | $3,741 | $35,979 |
| 2023 | $5,518 | $27,169 | $3,639 | $23,530 |
| 2022 | $5,117 | $37,260 | $5,160 | $32,100 |
| 2021 | $5,394 | $31,200 | $5,160 | $26,040 |
| 2020 | $5,385 | $30,840 | $5,160 | $25,680 |
| 2019 | $5,020 | $29,760 | $5,160 | $24,600 |
| 2018 | $4,615 | $22,641 | $4,868 | $17,773 |
| 2017 | $4,354 | $21,360 | $5,160 | $16,200 |
| 2016 | $1,032 | $5,160 | $5,160 | $0 |
| 2015 | $835 | $3,600 | $3,600 | $0 |
| 2014 | $835 | $4,352 | $4,352 | $0 |
Source: Public Records
Map
Nearby Homes
- 202 Chestnut Ave
- 89 Park Hill Ct
- 119 Skyline Dr
- 311 Tompkins Ave
- 442 Tompkins Ave
- 446 Tompkins Ave
- 50 Skyline Dr
- 111 Chestnut Ave
- 243 Saint Marys Ave
- 208 Osgood Ave
- 208 Saint Marys Ave
- 212 Saint Marys Ave
- 59 Bell St
- 42 Studio Ln
- 241 Tompkins Ave
- 22 Long Pond Ln
- 59 Park Hill Ave
- 103 Townsend Ave
- 242 Vanderbilt Ave
- 202 Virginia Ave
- 38-106 Burgundy Loop
- 36-106 Burgundy Loop
- 42 Burgundy Loop
- 34-106 Burgundy Loop
- 44 Burgundy Loop
- 32-106 Burgundy Loop
- 46 Burgundy Loop
- 30-106 Burgundy Loop
- 48 Burgundy Loop
- 28-106 Burgundy Loop
- 70-106 Burgundy Loop
- 76-106 Burgundy Loop
- 74-106 Burgundy Loop
- 68-106 Burgundy Loop
- 26-106 Burgundy Loop
- 78-106 Burgundy Loop
- 66-106 Burgundy Loop
- 50 Burgundy Loop
- 80-106 Burgundy Loop
- 64-106 Burgundy Loop