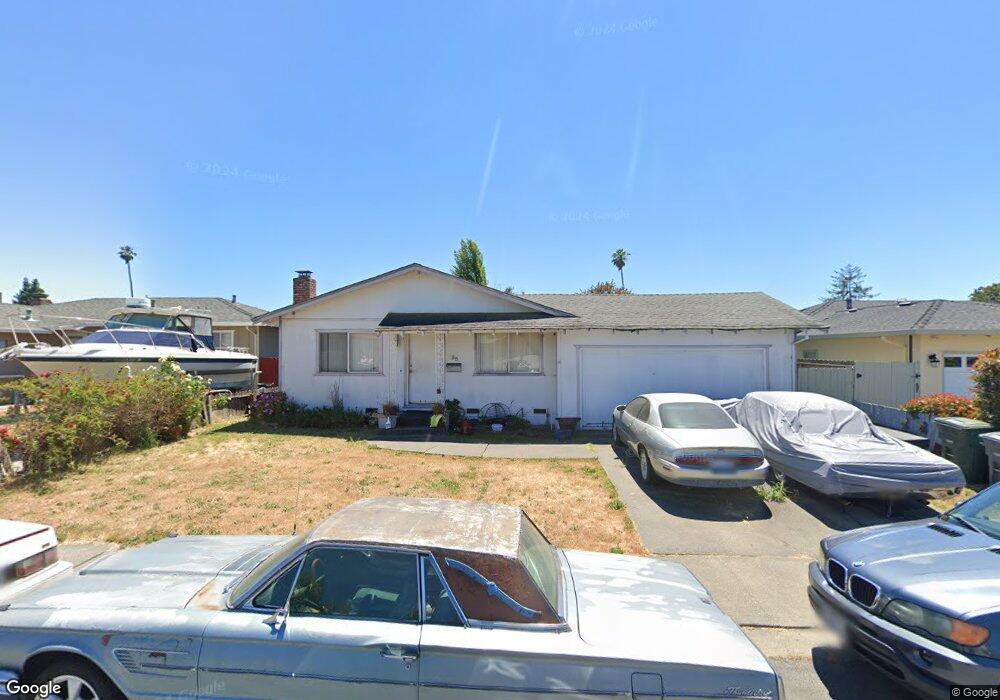
38 Carleton Dr Petaluma, CA 94952
Midtown NeighborhoodEstimated Value: $699,479 - $876,000
4
Beds
2
Baths
1,622
Sq Ft
$473/Sq Ft
Est. Value
About This Home
This home is located at 38 Carleton Dr, Petaluma, CA 94952 and is currently estimated at $767,620, approximately $473 per square foot. 38 Carleton Dr is a home located in Sonoma County with nearby schools including McKinley Elementary School, Petaluma Junior High School, and Petaluma High School.
Ownership History
Date
Name
Owned For
Owner Type
Purchase Details
Closed on
Dec 3, 2019
Sold by
Engstrom Roberto
Bought by
Engstrom Roberto and Roberto Engstrom Family Trust
Current Estimated Value
Purchase Details
Closed on
Dec 30, 2015
Sold by
Amerivine Town Center Llc
Bought by
Redwood Technology Center Llc
Home Financials for this Owner
Home Financials are based on the most recent Mortgage that was taken out on this home.
Original Mortgage
$35,172,000
Outstanding Balance
$27,954,714
Interest Rate
3.94%
Mortgage Type
Purchase Money Mortgage
Estimated Equity
-$27,187,094
Purchase Details
Closed on
Oct 13, 2010
Sold by
Gibson Jo Ann Engstrom and Engstrom Linda
Bought by
Engstrom Roberto
Purchase Details
Closed on
May 9, 1997
Sold by
National Bank Of The Redwoods
Bought by
Engstrom Clayton M and Engstrom Patricia C
Home Financials for this Owner
Home Financials are based on the most recent Mortgage that was taken out on this home.
Original Mortgage
$102,000
Interest Rate
5.25%
Purchase Details
Closed on
Nov 5, 1996
Sold by
Stark Krick Roy S and Stark Janet L
Bought by
National Bank Of The Redwoods
Create a Home Valuation Report for This Property
The Home Valuation Report is an in-depth analysis detailing your home's value as well as a comparison with similar homes in the area
Home Values in the Area
Average Home Value in this Area
Purchase History
| Date | Buyer | Sale Price | Title Company |
|---|---|---|---|
| Engstrom Roberto | -- | None Available | |
| Redwood Technology Center Llc | -- | Old Republic Title | |
| Engstrom Roberto | -- | None Available | |
| Engstrom Clayton M | $127,500 | Old Republic Title Company | |
| National Bank Of The Redwoods | $35,489 | North Bay Title |
Source: Public Records
Mortgage History
| Date | Status | Borrower | Loan Amount |
|---|---|---|---|
| Open | Redwood Technology Center Llc | $35,172,000 | |
| Previous Owner | Engstrom Clayton M | $102,000 |
Source: Public Records
Tax History
| Year | Tax Paid | Tax Assessment Tax Assessment Total Assessment is a certain percentage of the fair market value that is determined by local assessors to be the total taxable value of land and additions on the property. | Land | Improvement |
|---|---|---|---|---|
| 2025 | $2,375 | $203,562 | $135,714 | $67,848 |
| 2024 | $2,375 | $199,571 | $133,053 | $66,518 |
| 2023 | $2,375 | $195,659 | $130,445 | $65,214 |
| 2022 | $2,243 | $191,824 | $127,888 | $63,936 |
| 2021 | $2,203 | $188,064 | $125,381 | $62,683 |
| 2020 | $2,221 | $186,137 | $124,096 | $62,041 |
| 2019 | $2,195 | $182,488 | $121,663 | $60,825 |
| 2018 | $2,187 | $178,911 | $119,278 | $59,633 |
| 2017 | $2,143 | $175,404 | $116,940 | $58,464 |
| 2016 | $2,087 | $171,966 | $114,648 | $57,318 |
| 2015 | $2,060 | $169,384 | $112,926 | $56,458 |
| 2014 | $2,050 | $166,067 | $110,714 | $55,353 |
Source: Public Records
Map
Nearby Homes
- 101 Arlington Dr
- 66 Rio Vista Way
- 930 Martin Cir
- 712 E Washington St
- 1252 Petaluma Blvd N
- 1321 Mcneil Ave
- 224 Vallejo St
- 316 Vallejo St
- 320 Vallejo St
- 240 Park Place Dr
- 1533 Joan Dr
- 11 Montclair Ct
- 12 Rain Tree Ct
- 142 Cherry St
- 512 Kentucky St
- 111 Acorn Dr
- 6 Acorn Cir
- 65 Freedom Ln N
- 1642 Lauren Dr
- 331 Keller St Unit 6
- 42 Carleton Dr
- 34 Carleton Dr
- 37 Wilmington Dr
- 46 Carleton Dr
- 41 Wilmington Dr
- 33 Wilmington Dr
- 33 Carleton Dr
- 37 Carleton Dr
- 45 Wilmington Dr
- 50 Carleton Dr
- 41 Carleton Dr
- 913 Holly Ln
- 49 Wilmington Dr
- 909 Holly Ln
- 0 Quay Unit RS17176936
- 45 Carleton Dr
- 917 Holly Ln
- 905 Holly Ln
- 54 Carleton Dr
- 1 Faye Ct
Your Personal Tour Guide
Ask me questions while you tour the home.