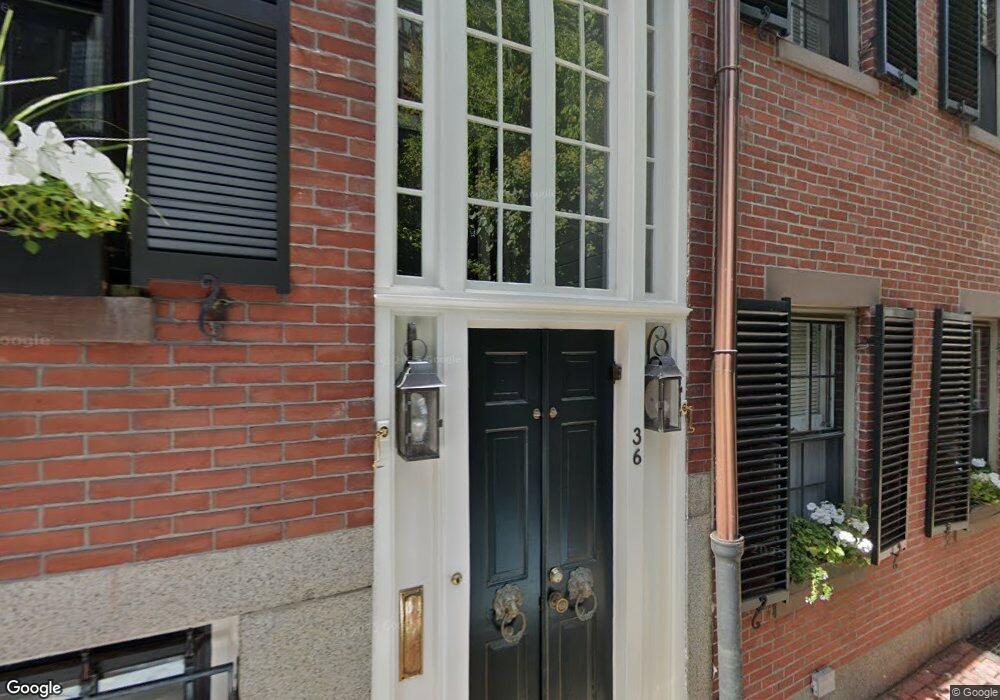
38 Cedar Lane Way Boston, MA 02108
Beacon Hill NeighborhoodEstimated Value: $1,892,000 - $2,414,000
2
Beds
2
Baths
1,650
Sq Ft
$1,274/Sq Ft
Est. Value
About This Home
This home is located at 38 Cedar Lane Way, Boston, MA 02108 and is currently estimated at $2,102,490, approximately $1,274 per square foot. 38 Cedar Lane Way is a home located in Suffolk County with nearby schools including Advent School, Torit Montessori School, and Park Street School.
Ownership History
Date
Name
Owned For
Owner Type
Purchase Details
Closed on
Oct 25, 2023
Sold by
Hotaling Thomas M
Bought by
Thomas M Hotaling T M and Thomas Hotaling
Current Estimated Value
Purchase Details
Closed on
Jun 14, 2010
Sold by
Mayman Myra A and Bernhard Alexander A
Bought by
Hotaling Thomas M
Home Financials for this Owner
Home Financials are based on the most recent Mortgage that was taken out on this home.
Original Mortgage
$523,000
Interest Rate
5.11%
Mortgage Type
Purchase Money Mortgage
Create a Home Valuation Report for This Property
The Home Valuation Report is an in-depth analysis detailing your home's value as well as a comparison with similar homes in the area
Home Values in the Area
Average Home Value in this Area
Purchase History
| Date | Buyer | Sale Price | Title Company |
|---|---|---|---|
| Thomas M Hotaling T M | -- | None Available | |
| Hotaling Thomas M | $1,121,500 | -- |
Source: Public Records
Mortgage History
| Date | Status | Borrower | Loan Amount |
|---|---|---|---|
| Previous Owner | Hotaling Thomas M | $523,000 |
Source: Public Records
Tax History Compared to Growth
Tax History
| Year | Tax Paid | Tax Assessment Tax Assessment Total Assessment is a certain percentage of the fair market value that is determined by local assessors to be the total taxable value of land and additions on the property. | Land | Improvement |
|---|---|---|---|---|
| 2025 | $22,092 | $1,907,800 | $1,241,000 | $666,800 |
| 2024 | $21,407 | $1,963,900 | $1,111,500 | $852,400 |
| 2023 | $21,092 | $1,963,900 | $1,111,500 | $852,400 |
| 2022 | $20,351 | $1,870,500 | $1,058,600 | $811,900 |
| 2021 | $19,566 | $1,833,700 | $1,037,800 | $795,900 |
| 2020 | $17,450 | $1,652,500 | $851,100 | $801,400 |
| 2019 | $16,582 | $1,573,200 | $695,600 | $877,600 |
| 2018 | $14,201 | $1,355,100 | $695,600 | $659,500 |
| 2017 | $13,666 | $1,290,500 | $695,600 | $594,900 |
| 2016 | $13,650 | $1,240,900 | $695,600 | $545,300 |
| 2015 | $15,484 | $1,278,600 | $606,600 | $672,000 |
| 2014 | $15,319 | $1,217,700 | $606,600 | $611,100 |
Source: Public Records
Map
Nearby Homes
- 75 Charles St Unit 4B
- 32 W Cedar St
- 15 W Cedar St
- 52 River St
- 111 Pinckney St Unit 2
- 11 W Cedar St
- 22 Louisburg Square
- 22 Brimmer St
- 101 Pinckney St
- 94 Mount Vernon St
- 145 Pinckney Street Concierge Bldg Unit 603-605
- 120 Charles St
- 90 Mount Vernon St
- 32 Lime St
- 80 Revere St Unit 1
- 62 Chestnut St
- 86 Mount Vernon St
- 41 Chestnut St
- 59 W Cedar St Unit 6
- 140 Charles St Unit 2
- 36 Cedar Lane Way
- 40 Cedar Lane Way
- 34 Cedar Lane Way
- 71 Charles St
- 71 Charles St Unit 1
- 42 Cedar Lane Way Unit 1
- 69 Charles St
- 69 Charles St Unit 3
- 69 Charles St Unit 1
- 44 Cedar Lane Way Unit SF
- 44 Cedar Lane Way
- 32 Cedar Lane Way
- 65 Charles St Unit 1
- 65 Charles St Unit 2
- 73 Charles St Unit 3
- 73 Charles St Unit 2
- 73 Charles St Unit 5A
- 73 Charles St Unit 4A
- 73 Charles St Unit 3A
- 73 Charles St Unit 2A