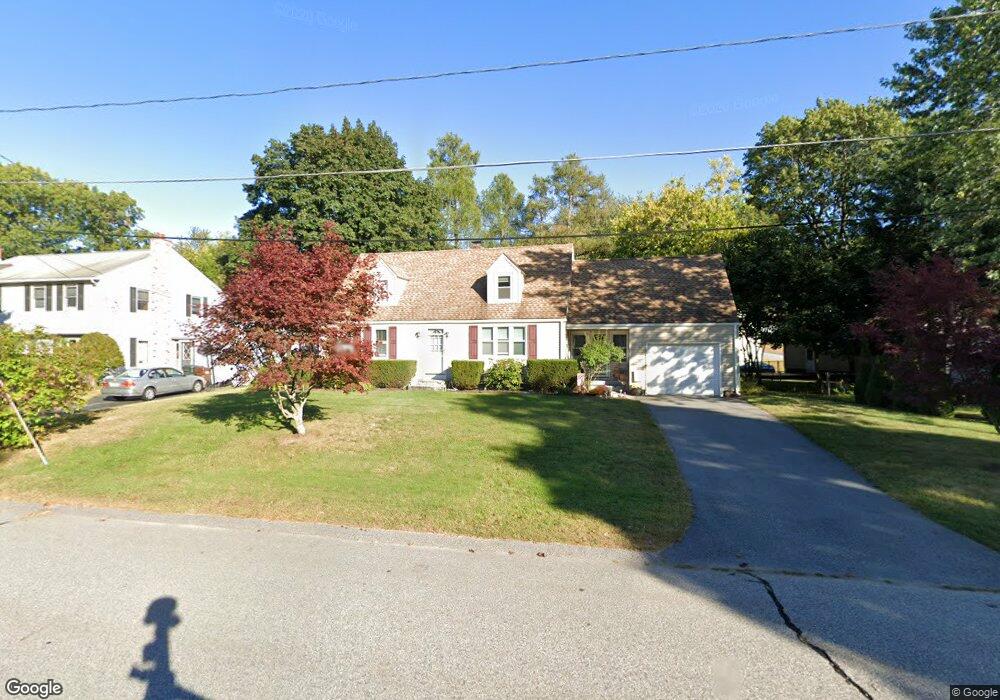
38 Chestnut Ave Auburn, MA 01501
Stoneville NeighborhoodEstimated Value: $461,000 - $553,000
4
Beds
3
Baths
1,310
Sq Ft
$379/Sq Ft
Est. Value
About This Home
This home is located at 38 Chestnut Ave, Auburn, MA 01501 and is currently estimated at $496,903, approximately $379 per square foot. 38 Chestnut Ave is a home located in Worcester County with nearby schools including Auburn Senior High School, Canterbury Street School, and Shrewsbury Montessori School - Auburn Campus.
Ownership History
Date
Name
Owned For
Owner Type
Purchase Details
Closed on
May 12, 2010
Sold by
Macquarrie Allan M and Macquarrie Kerrie A
Bought by
Macquarrie Kerrie A
Current Estimated Value
Purchase Details
Closed on
Jul 1, 1997
Sold by
Pasierb Judith E
Bought by
Macquarrie Allan M and Macquarrie Kerrie A
Home Financials for this Owner
Home Financials are based on the most recent Mortgage that was taken out on this home.
Original Mortgage
$105,000
Interest Rate
7.81%
Mortgage Type
Purchase Money Mortgage
Purchase Details
Closed on
Feb 9, 1987
Sold by
Navickas Anthony F
Bought by
Nest William T
Create a Home Valuation Report for This Property
The Home Valuation Report is an in-depth analysis detailing your home's value as well as a comparison with similar homes in the area
Home Values in the Area
Average Home Value in this Area
Purchase History
| Date | Buyer | Sale Price | Title Company |
|---|---|---|---|
| Macquarrie Kerrie A | -- | -- | |
| Macquarrie Allan M | $149,000 | -- | |
| Nest William T | $126,000 | -- |
Source: Public Records
Mortgage History
| Date | Status | Borrower | Loan Amount |
|---|---|---|---|
| Open | Nest William T | $161,800 | |
| Previous Owner | Nest William T | $129,500 | |
| Previous Owner | Nest William T | $25,000 | |
| Previous Owner | Nest William T | $105,000 |
Source: Public Records
Tax History Compared to Growth
Tax History
| Year | Tax Paid | Tax Assessment Tax Assessment Total Assessment is a certain percentage of the fair market value that is determined by local assessors to be the total taxable value of land and additions on the property. | Land | Improvement |
|---|---|---|---|---|
| 2025 | $59 | $413,300 | $112,600 | $300,700 |
| 2024 | $5,782 | $387,300 | $106,700 | $280,600 |
| 2023 | $5,691 | $358,400 | $96,900 | $261,500 |
| 2022 | $5,256 | $312,500 | $96,900 | $215,600 |
| 2021 | $0 | $275,500 | $85,500 | $190,000 |
| 2020 | $4,732 | $263,200 | $85,500 | $177,700 |
| 2019 | $4,611 | $250,300 | $84,700 | $165,600 |
| 2018 | $4,398 | $238,500 | $79,100 | $159,400 |
| 2017 | $4,191 | $228,500 | $71,800 | $156,700 |
| 2016 | $3,953 | $218,500 | $74,800 | $143,700 |
| 2015 | $3,609 | $209,100 | $74,800 | $134,300 |
| 2014 | $3,539 | $204,700 | $71,300 | $133,400 |
Source: Public Records
Map
Nearby Homes
- 176 Boyce St
- 5 Commonwealth Ave
- 8 Shirley St
- 177 Boyce St
- 4 S Edlin St
- 25 Vinal St Unit 26
- 25 Vinal St Unit 29
- 25 Vinal St Unit 30
- 2 Keen St
- 20 Alpine Trail
- 24 Meena Dr
- 177 Oxford St N
- 34 Rockland Rd
- 53 James St
- 35 Genessee St Unit I
- 27 Havana Rd
- 19-20 Williams St
- 170 Stafford St
- 33 Walsh Ave
- 31-33 Walsh Ave