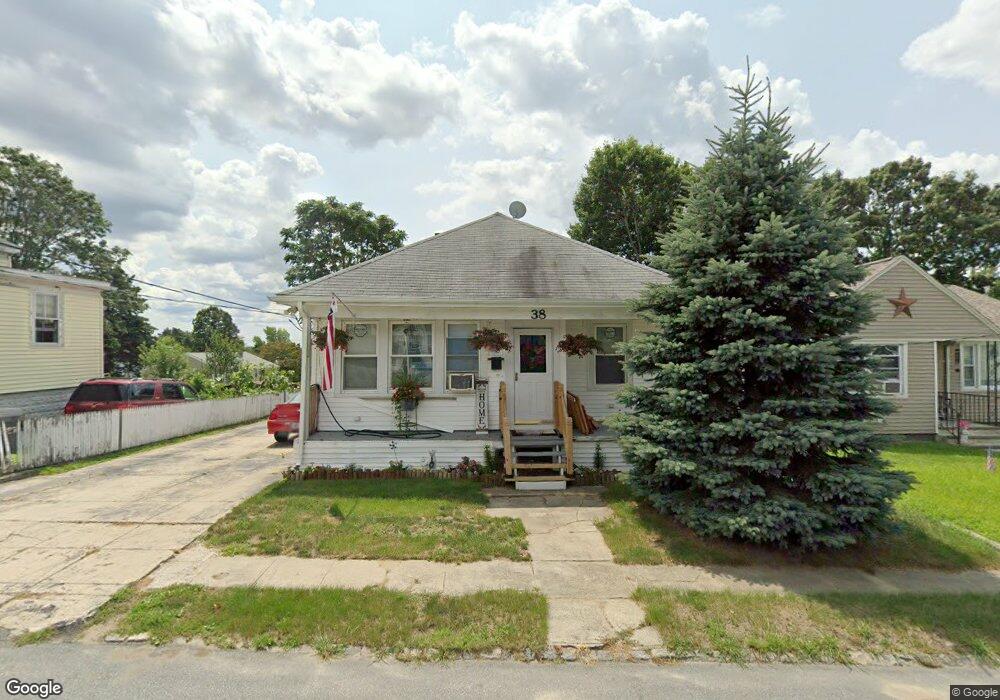
38 Cliff Ave Cranston, RI 02920
Laurel Hill NeighborhoodEstimated Value: $362,347 - $417,000
3
Beds
1
Bath
1,160
Sq Ft
$339/Sq Ft
Est. Value
About This Home
This home is located at 38 Cliff Ave, Cranston, RI 02920 and is currently estimated at $392,837, approximately $338 per square foot. 38 Cliff Ave is a home located in Providence County with nearby schools including Hugh B. Bain Middle School, Cranston High School East, and Achievement First Iluminar Mayoral Academy.
Ownership History
Date
Name
Owned For
Owner Type
Purchase Details
Closed on
Nov 21, 2020
Sold by
Niederberger David L
Bought by
Niederberger David L and Niederberger Sandra A
Current Estimated Value
Purchase Details
Closed on
Aug 31, 2011
Sold by
Niederberger Jean M
Bought by
Niederberger David
Home Financials for this Owner
Home Financials are based on the most recent Mortgage that was taken out on this home.
Original Mortgage
$161,600
Interest Rate
3.87%
Mortgage Type
FHA
Purchase Details
Closed on
Feb 9, 1990
Sold by
Est Marcoccio Luigi
Bought by
Niederberg David L
Home Financials for this Owner
Home Financials are based on the most recent Mortgage that was taken out on this home.
Original Mortgage
$103,550
Interest Rate
9.64%
Create a Home Valuation Report for This Property
The Home Valuation Report is an in-depth analysis detailing your home's value as well as a comparison with similar homes in the area
Home Values in the Area
Average Home Value in this Area
Purchase History
| Date | Buyer | Sale Price | Title Company |
|---|---|---|---|
| Niederberger David L | -- | None Available | |
| Niederberger David | -- | -- | |
| Niederberg David L | $109,000 | -- |
Source: Public Records
Mortgage History
| Date | Status | Borrower | Loan Amount |
|---|---|---|---|
| Previous Owner | Niederberg David L | $161,600 | |
| Previous Owner | Niederberg David L | $163,000 | |
| Previous Owner | Niederberg David L | $120,000 | |
| Previous Owner | Niederberg David L | $103,550 |
Source: Public Records
Tax History
| Year | Tax Paid | Tax Assessment Tax Assessment Total Assessment is a certain percentage of the fair market value that is determined by local assessors to be the total taxable value of land and additions on the property. | Land | Improvement |
|---|---|---|---|---|
| 2025 | $3,824 | $275,500 | $87,600 | $187,900 |
| 2024 | $3,750 | $275,500 | $87,600 | $187,900 |
| 2023 | $3,512 | $185,800 | $60,400 | $125,400 |
| 2022 | $3,439 | $185,800 | $60,400 | $125,400 |
| 2021 | $3,344 | $185,800 | $60,400 | $125,400 |
| 2020 | $3,028 | $145,800 | $47,000 | $98,800 |
| 2019 | $3,028 | $145,800 | $47,000 | $98,800 |
| 2018 | $2,958 | $145,800 | $47,000 | $98,800 |
| 2017 | $2,631 | $114,700 | $36,900 | $77,800 |
| 2016 | $2,575 | $114,700 | $36,900 | $77,800 |
| 2015 | $2,575 | $114,700 | $36,900 | $77,800 |
| 2014 | $2,524 | $110,500 | $36,900 | $73,600 |
Source: Public Records
Map
Nearby Homes
- 51 Old Oak Ave
- 0 Princess Ave
- 79 Chestnut Hill Ave
- 151 Chestnut Hill Ave
- 92 Old Oak Ave
- 30 Lark Ave
- 19 Pavilion Ct
- 95 Elwyn St
- 62 Browne St
- 1250 Cranston St
- 1303 Cranston St
- 761 Dyer Ave
- 2 Gansett Ave
- 33 Princess Ave
- 18 Doane St
- 74 Lake St Unit 76
- 60 Lowell St
- 9 Southern St
- 7 Maple St
- 161 Prudence Ave
Your Personal Tour Guide
Ask me questions while you tour the home.