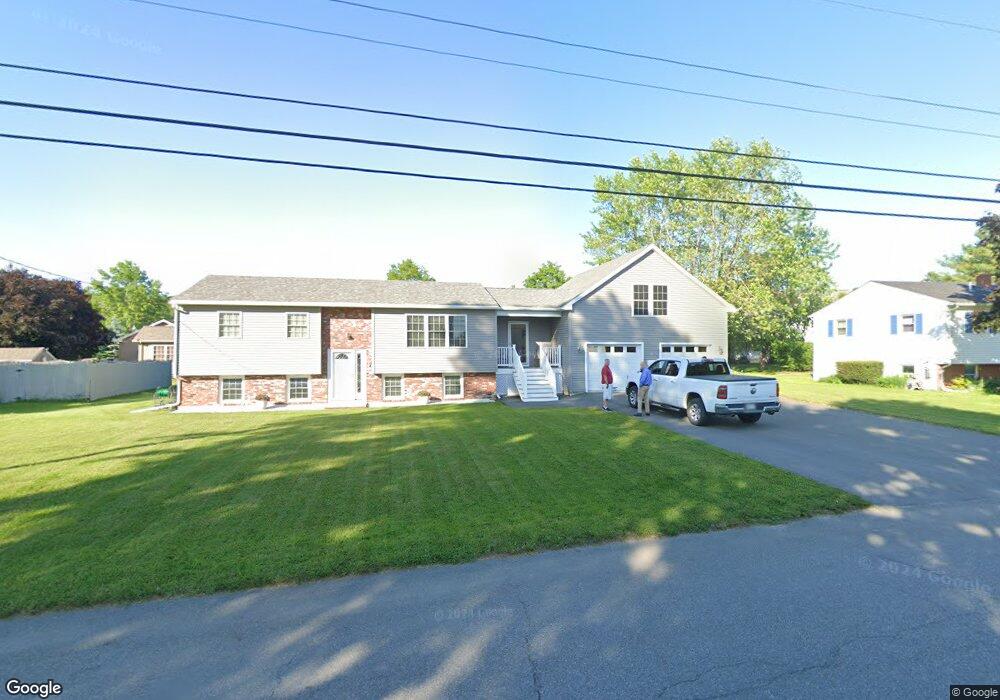
38 Clover Ln Brewer, ME 04412
Estimated Value: $314,756 - $398,000
4
Beds
1
Bath
1,762
Sq Ft
$197/Sq Ft
Est. Value
About This Home
This home is located at 38 Clover Ln, Brewer, ME 04412 and is currently estimated at $347,189, approximately $197 per square foot. 38 Clover Ln is a home located in Penobscot County with nearby schools including Brewer Community School, Brewer High School, and All Saints Catholic School St. Mary's campus PreK-3.
Ownership History
Date
Name
Owned For
Owner Type
Purchase Details
Closed on
Aug 3, 2015
Sold by
Pike Bryan
Bought by
Kelley Daren
Current Estimated Value
Home Financials for this Owner
Home Financials are based on the most recent Mortgage that was taken out on this home.
Original Mortgage
$148,500
Outstanding Balance
$114,941
Interest Rate
3.97%
Mortgage Type
Unknown
Estimated Equity
$232,248
Purchase Details
Closed on
Mar 19, 2015
Sold by
Simko Joseph R Est
Bought by
Pike Bryan
Create a Home Valuation Report for This Property
The Home Valuation Report is an in-depth analysis detailing your home's value as well as a comparison with similar homes in the area
Home Values in the Area
Average Home Value in this Area
Purchase History
| Date | Buyer | Sale Price | Title Company |
|---|---|---|---|
| Kelley Daren | -- | -- | |
| Pike Bryan | -- | -- |
Source: Public Records
Mortgage History
| Date | Status | Borrower | Loan Amount |
|---|---|---|---|
| Open | Kelley Daren | $148,500 |
Source: Public Records
Tax History
| Year | Tax Paid | Tax Assessment Tax Assessment Total Assessment is a certain percentage of the fair market value that is determined by local assessors to be the total taxable value of land and additions on the property. | Land | Improvement |
|---|---|---|---|---|
| 2025 | $4,551 | $295,500 | $28,400 | $267,100 |
| 2024 | $4,501 | $239,400 | $28,400 | $211,000 |
| 2023 | $4,364 | $217,100 | $26,400 | $190,700 |
| 2021 | $4,246 | $190,400 | $26,000 | $164,400 |
| 2020 | $4,320 | $189,900 | $26,000 | $163,900 |
| 2019 | $4,366 | $189,900 | $26,000 | $163,900 |
| 2018 | $3,668 | $163,000 | $26,000 | $137,000 |
| 2017 | $2,970 | $132,000 | $26,000 | $106,000 |
| 2016 | $2,841 | $132,000 | $26,000 | $106,000 |
| 2015 | $2,410 | $112,000 | $26,000 | $86,000 |
| 2014 | $2,343 | $112,000 | $26,000 | $86,000 |
| 2013 | -- | $116,300 | $26,500 | $89,800 |
Source: Public Records
Map
Nearby Homes
Your Personal Tour Guide
Ask me questions while you tour the home.