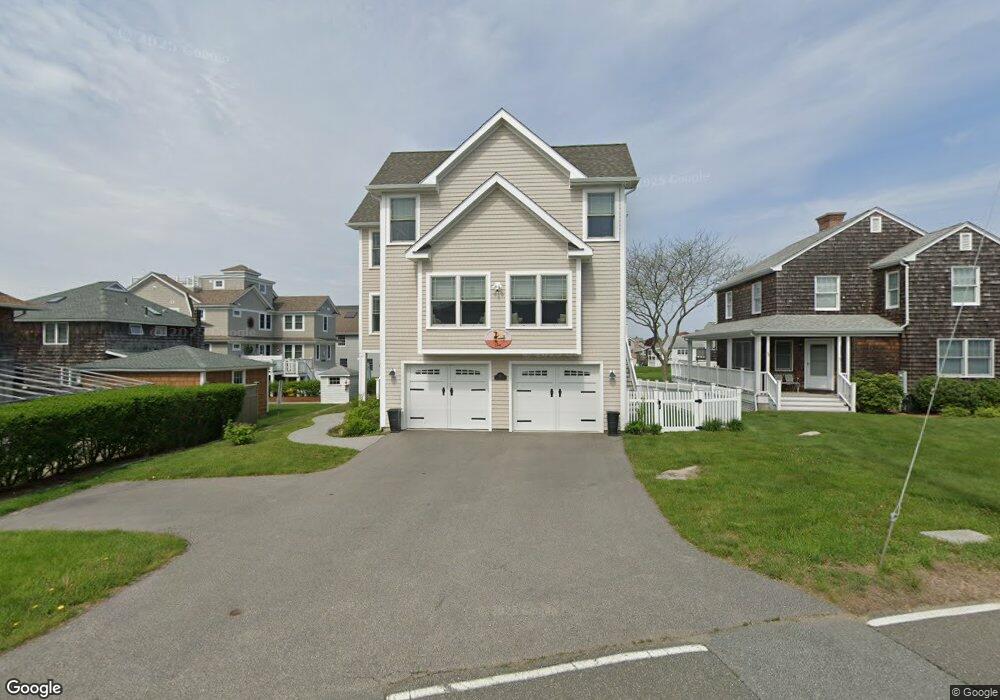
38 Crescent St Groton, CT 06340
Estimated Value: $1,483,000 - $1,666,109
3
Beds
3
Baths
2,426
Sq Ft
$657/Sq Ft
Est. Value
About This Home
This home is located at 38 Crescent St, Groton, CT 06340 and is currently estimated at $1,593,036, approximately $656 per square foot. 38 Crescent St is a home with nearby schools including Groton Middle School and Robert E. Fitch High School.
Ownership History
Date
Name
Owned For
Owner Type
Purchase Details
Closed on
Nov 11, 2020
Sold by
Bibby Steven M and Bibby Margaret C
Bought by
Buteau Christopher L and Buteau Cathryn A
Current Estimated Value
Home Financials for this Owner
Home Financials are based on the most recent Mortgage that was taken out on this home.
Original Mortgage
$900,000
Outstanding Balance
$800,872
Interest Rate
2.8%
Mortgage Type
Purchase Money Mortgage
Estimated Equity
$792,164
Purchase Details
Closed on
Jul 28, 2017
Sold by
Bibby Steven M
Bought by
Bibby Steven M and Bibby Margaret C
Purchase Details
Closed on
May 8, 2015
Sold by
Smyth Norbert E and Smyth Eileen R
Bought by
Bibby Steven M
Home Financials for this Owner
Home Financials are based on the most recent Mortgage that was taken out on this home.
Original Mortgage
$300,000
Interest Rate
3.69%
Mortgage Type
Purchase Money Mortgage
Create a Home Valuation Report for This Property
The Home Valuation Report is an in-depth analysis detailing your home's value as well as a comparison with similar homes in the area
Home Values in the Area
Average Home Value in this Area
Purchase History
| Date | Buyer | Sale Price | Title Company |
|---|---|---|---|
| Buteau Christopher L | $1,125,000 | None Available | |
| Bibby Steven M | -- | -- | |
| Bibby Steven M | $350,000 | -- |
Source: Public Records
Mortgage History
| Date | Status | Borrower | Loan Amount |
|---|---|---|---|
| Open | Buteau Christopher L | $900,000 | |
| Previous Owner | Bibby Steven M | $300,000 |
Source: Public Records
Tax History Compared to Growth
Tax History
| Year | Tax Paid | Tax Assessment Tax Assessment Total Assessment is a certain percentage of the fair market value that is determined by local assessors to be the total taxable value of land and additions on the property. | Land | Improvement |
|---|---|---|---|---|
| 2025 | $20,598 | $731,220 | $456,820 | $274,400 |
| 2024 | $19,333 | $731,220 | $456,820 | $274,400 |
| 2023 | $18,639 | $731,220 | $339,220 | $392,000 |
| 2022 | $18,288 | $731,220 | $339,220 | $392,000 |
| 2021 | $15,100 | $501,480 | $226,170 | $275,310 |
| 2020 | $14,618 | $492,730 | $226,170 | $266,560 |
| 2019 | $14,017 | $492,730 | $226,170 | $266,560 |
| 2018 | $6,306 | $226,170 | $226,170 | $0 |
| 2017 | $6,181 | $226,170 | $226,170 | $0 |
| 2016 | $6,061 | $245,140 | $244,930 | $210 |
| 2015 | $5,870 | $245,140 | $244,930 | $210 |
Source: Public Records
Map
Nearby Homes