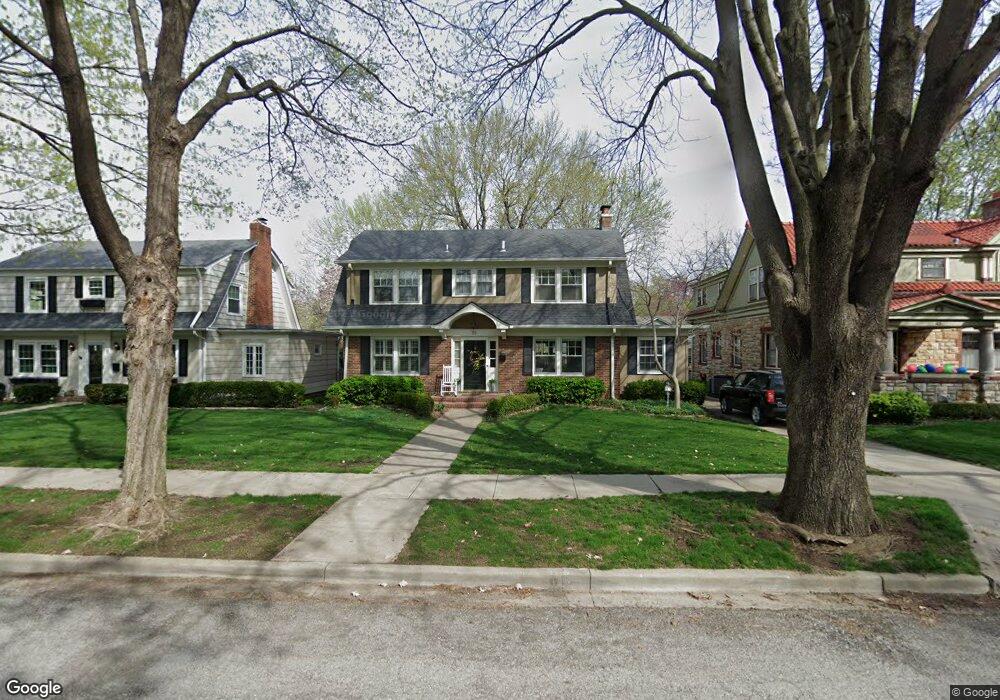
38 E 68th St Kansas City, MO 64113
Armour Hills NeighborhoodEstimated Value: $376,000 - $501,648
3
Beds
2
Baths
1,950
Sq Ft
$238/Sq Ft
Est. Value
About This Home
This home is located at 38 E 68th St, Kansas City, MO 64113 and is currently estimated at $463,162, approximately $237 per square foot. 38 E 68th St is a home located in Jackson County with nearby schools including Hale Cook Elementary, Central Middle School, and Southeast High School.
Ownership History
Date
Name
Owned For
Owner Type
Purchase Details
Closed on
Nov 17, 2004
Sold by
Shaw Michael P and Shaw Lisa Mary Severin
Bought by
Oconnor William M and Oconnor Elaine M
Current Estimated Value
Home Financials for this Owner
Home Financials are based on the most recent Mortgage that was taken out on this home.
Original Mortgage
$206,300
Interest Rate
5.16%
Mortgage Type
Purchase Money Mortgage
Purchase Details
Closed on
Jun 25, 1997
Sold by
Churan G Castel Tr
Bought by
Shaw Michael P and Shaw Lisa Mary Severin
Home Financials for this Owner
Home Financials are based on the most recent Mortgage that was taken out on this home.
Original Mortgage
$88,000
Interest Rate
7.87%
Mortgage Type
Purchase Money Mortgage
Purchase Details
Closed on
Dec 30, 1996
Sold by
Churan G Castle and Churan Lorraine E
Bought by
Livi Churan G Castle and G Castle Churan Revocable Living Trust
Create a Home Valuation Report for This Property
The Home Valuation Report is an in-depth analysis detailing your home's value as well as a comparison with similar homes in the area
Home Values in the Area
Average Home Value in this Area
Purchase History
| Date | Buyer | Sale Price | Title Company |
|---|---|---|---|
| Oconnor William M | -- | Ctic | |
| Shaw Michael P | -- | Stewart Title | |
| Livi Churan G Castle | -- | -- |
Source: Public Records
Mortgage History
| Date | Status | Borrower | Loan Amount |
|---|---|---|---|
| Closed | Oconnor William M | $206,300 | |
| Previous Owner | Shaw Michael P | $88,000 |
Source: Public Records
Tax History
| Year | Tax Paid | Tax Assessment Tax Assessment Total Assessment is a certain percentage of the fair market value that is determined by local assessors to be the total taxable value of land and additions on the property. | Land | Improvement |
|---|---|---|---|---|
| 2025 | $5,698 | $73,372 | $9,329 | $64,043 |
| 2024 | $6,168 | $72,200 | $9,692 | $62,508 |
| 2023 | $6,168 | $78,902 | $9,624 | $69,278 |
| 2022 | $4,564 | $55,480 | $7,913 | $47,567 |
| 2021 | $4,548 | $55,480 | $7,913 | $47,567 |
| 2020 | $4,391 | $52,900 | $7,913 | $44,987 |
| 2019 | $4,300 | $52,900 | $7,913 | $44,987 |
| 2018 | $3,665 | $46,040 | $6,887 | $39,153 |
| 2016 | $3,445 | $43,041 | $8,283 | $34,758 |
Source: Public Records
Map
Nearby Homes
- 210 E Winthrope Rd
- 6811 Oak St
- 200 W 68th Terrace
- 39 W Winthrope Rd
- 6728 Cherry St
- 6841 Oak Terrace
- 6709 Cherry St
- 415 E 65th Terrace
- 417 E 69th Terrace
- 331 E Dartmouth Rd
- 6720 Holmes Rd
- 6820 Holmes Rd
- 408 E 70th Terrace
- 6415 Baltimore Ave
- 6928 Wornall Rd
- 6404 McGee St
- 103 E Meyer Blvd
- 39 W 70th Terrace
- 6531 Holmes Rd
- 6330 Oak St
Your Personal Tour Guide
Ask me questions while you tour the home.