38 E Main St Gloucester, MA 01930
East Gloucester NeighborhoodEstimated Value: $463,000 - $627,000
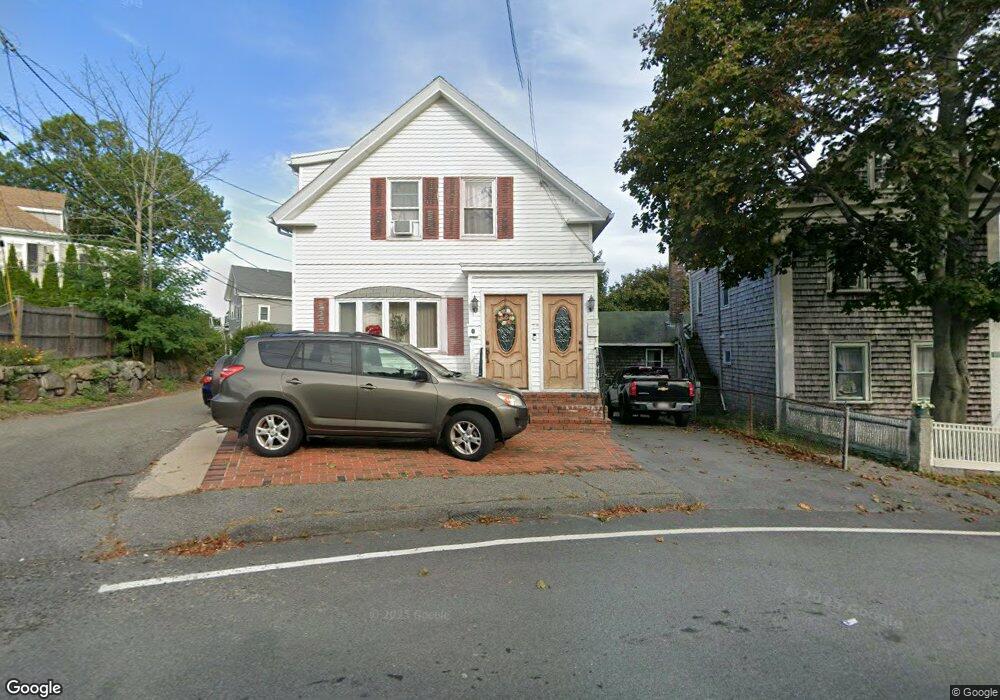
About This Home
This home is located at 38 E Main St, Gloucester, MA 01930 and is currently estimated at $581,619, approximately $347 per square foot. 38 E Main St is a home located in Essex County with nearby schools including East Gloucester Elementary School, Ralph B O'maley Middle School, and Gloucester High School.
Ownership History
We collect this data history from publicly available records. To have your information removed, we recommend requesting removal directly through your county’s website.
Purchase Details
Home Financials for this Owner
Home Financials are based on the most recent Mortgage that was taken out on this home.Home Values in the Area
Average Home Value in this Area
Purchase History
We collect this data history from publicly available records. To have your information removed, we recommend requesting removal directly through your county’s website.
| Date | Buyer | Sale Price | Title Company |
|---|---|---|---|
| $168,500 | -- |
Mortgage History
We collect this data history from publicly available records. To have your information removed, we recommend requesting removal directly through your county’s website.
| Date | Status | Borrower | Loan Amount |
|---|---|---|---|
| Open | $95,446 | ||
| Closed | $103,300 | ||
| Closed | $116,000 | ||
| Closed | $123,500 |
Tax History
We collect this data history from publicly available records. To have your information removed, we recommend requesting removal directly through your county’s website.
| Year | Tax Paid | Tax Assessment Tax Assessment Total Assessment is a certain percentage of the fair market value that is determined by local assessors to be the total taxable value of land and additions on the property. | Land | Improvement |
|---|---|---|---|---|
| 2025 | $4,729 | $486,500 | $137,000 | $349,500 |
| 2024 | $4,637 | $476,600 | $130,400 | $346,200 |
| 2023 | $4,779 | $451,300 | $116,500 | $334,800 |
| 2022 | $4,484 | $382,300 | $101,300 | $281,000 |
| 2021 | $4,337 | $348,600 | $92,100 | $256,500 |
| 2020 | $4,117 | $333,900 | $92,100 | $241,800 |
| 2019 | $3,845 | $303,000 | $92,100 | $210,900 |
| 2018 | $3,601 | $278,500 | $92,100 | $186,400 |
| 2017 | $3,443 | $261,000 | $87,700 | $173,300 |
| 2016 | $3,401 | $249,900 | $91,500 | $158,400 |
| 2015 | $3,344 | $245,000 | $91,500 | $153,500 |
Map
- 42 E Main St
- 8 Blake Ct
- 38R Bass Ave
- 18 Traverse St
- 2 Harrison Ave
- 4 Graystone Rd
- 5 Mount Pleasant Ave
- 30 Chapel St Unit B
- 141 Prospect St
- 141 Prospect St Unit B
- 141 Prospect St Unit A
- 14R Spring St Unit 3
- 23 Mount Vernon St
- 8 Atlantic Rd
- 197 E Main St Unit 1
- 5 Pirates Ln Unit 11
- 30R Highland St
- 274 Main St Unit 4
- 222 Main St
- 36 Warner St
- 40 E Main St
- 17 Mondello Square
- 44 E Main St
- 19 Mondello Square
- 45 E Main St Unit 2
- 45 E Main St
- 45 E Main St Unit 3
- 15 Mondello Square
- 47 E Main St
- 13 Mondello Square Unit B
- 13 Mondello Square Unit A
- 13 Mondello Square Unit 1
- 18&18R Mondello Square
- 41 E Main St
- 18 Mondello Square Unit 2
- 18 Mondello Square Unit 1
- 49 E Main St
- 36 E Main St
- 11 Amero Ct
- 11 Mondello Square
Ask me questions while you tour the home.