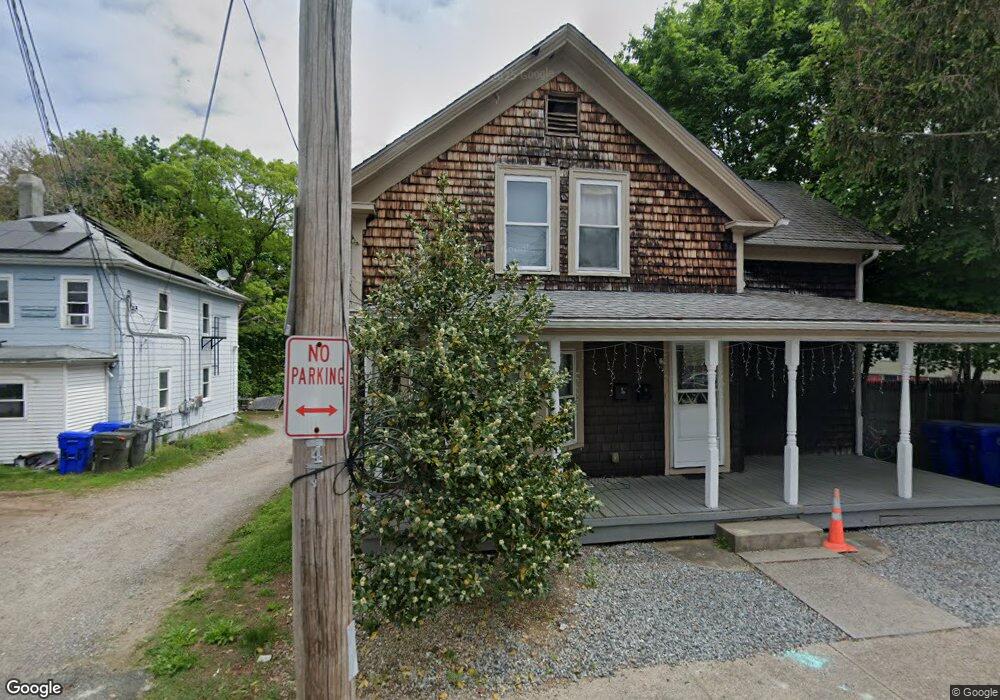
38 Epworth Ave West Warwick, RI 02893
Centreville NeighborhoodEstimated Value: $316,000 - $406,000
4
Beds
2
Baths
1,450
Sq Ft
$255/Sq Ft
Est. Value
About This Home
This home is located at 38 Epworth Ave, West Warwick, RI 02893 and is currently estimated at $369,045, approximately $254 per square foot. 38 Epworth Ave is a home located in Kent County with nearby schools including West Warwick High School.
Ownership History
Date
Name
Owned For
Owner Type
Purchase Details
Closed on
Feb 20, 2025
Sold by
Cook Richard B
Bought by
Richard B Cook Lt and Cook
Current Estimated Value
Purchase Details
Closed on
Dec 19, 2002
Sold by
Obryan Steven W and Obryan Diane F
Bought by
Cook Richard B
Purchase Details
Closed on
Jun 3, 1996
Sold by
Essex Home Mtg Svc Co
Bought by
Obryan Steven W and Obryan Diane
Home Financials for this Owner
Home Financials are based on the most recent Mortgage that was taken out on this home.
Original Mortgage
$51,975
Interest Rate
7.91%
Create a Home Valuation Report for This Property
The Home Valuation Report is an in-depth analysis detailing your home's value as well as a comparison with similar homes in the area
Home Values in the Area
Average Home Value in this Area
Purchase History
| Date | Buyer | Sale Price | Title Company |
|---|---|---|---|
| Richard B Cook Lt | -- | None Available | |
| Richard B Cook Lt | -- | None Available | |
| Cook Richard B | $107,000 | -- | |
| Cook Richard B | $107,000 | -- | |
| Obryan Steven W | $58,000 | -- | |
| Obryan Steven W | $58,000 | -- |
Source: Public Records
Mortgage History
| Date | Status | Borrower | Loan Amount |
|---|---|---|---|
| Previous Owner | Obryan Steven W | $51,975 |
Source: Public Records
Tax History Compared to Growth
Tax History
| Year | Tax Paid | Tax Assessment Tax Assessment Total Assessment is a certain percentage of the fair market value that is determined by local assessors to be the total taxable value of land and additions on the property. | Land | Improvement |
|---|---|---|---|---|
| 2025 | $4,118 | $288,200 | $62,500 | $225,700 |
| 2024 | $4,291 | $229,600 | $39,100 | $190,500 |
| 2023 | $4,206 | $229,600 | $39,100 | $190,500 |
| 2022 | $4,142 | $229,600 | $39,100 | $190,500 |
| 2021 | $3,823 | $166,200 | $39,100 | $127,100 |
| 2020 | $3,823 | $166,200 | $39,100 | $127,100 |
| 2019 | $4,873 | $166,200 | $39,100 | $127,100 |
| 2018 | $2 | $124,700 | $39,100 | $85,600 |
| 2017 | $3,281 | $124,700 | $39,100 | $85,600 |
| 2016 | $3,222 | $124,700 | $39,100 | $85,600 |
| 2015 | $2,869 | $110,500 | $39,100 | $71,400 |
| 2014 | $2,806 | $110,500 | $39,100 | $71,400 |
Source: Public Records
Map
Nearby Homes
- 38 1/2 Epworth Ave
- 36 Epworth Ave
- 40 Epworth Ave
- 44 Epworth Ave
- 42 Epworth Ave
- 34 Epworth Ave
- 28 Epworth Ave
- 32 Epworth Ave
- 48 Epworth Ave
- 37 Epworth Ave
- 33 Epworth Ave
- 33 Epworth Ave Unit 2
- 29 Epworth Ave
- 43 Epworth Ave
- 50 Epworth Ave
- 31 Epworth Ave
- 40 Riverdale Ave
- 52 Epworth Ave
- 1384 Main St
- 41 Crossen St