38 Ffrost Dr Durham, NH 03824
Estimated Value: $630,000 - $700,221
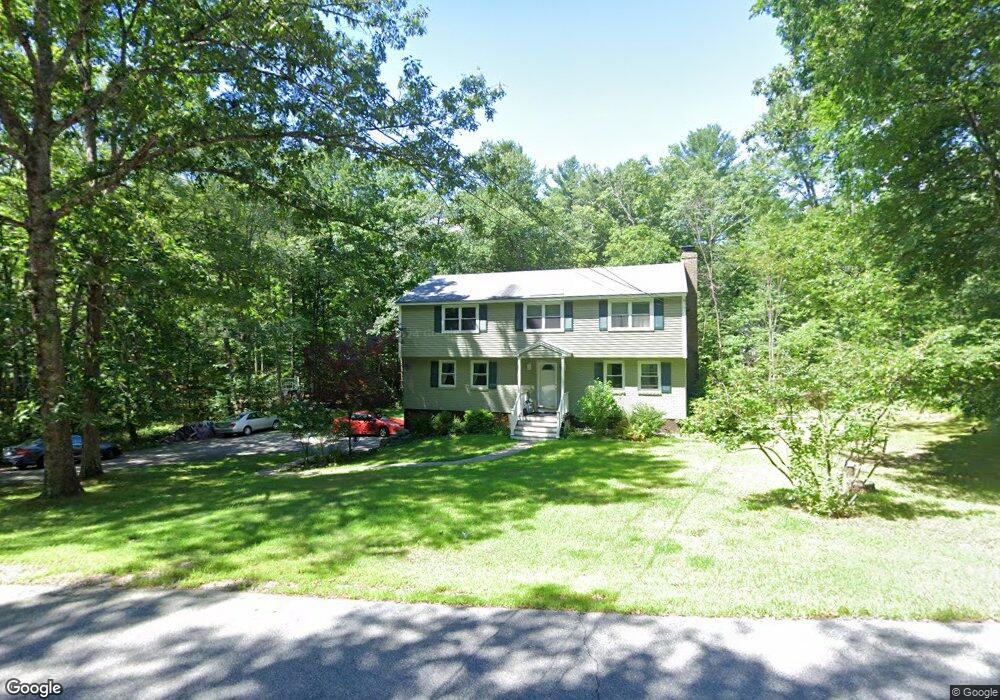
About This Home
This home is located at 38 Ffrost Dr, Durham, NH 03824 and is currently estimated at $662,555, approximately $194 per square foot. 38 Ffrost Dr is a home located in Strafford County with nearby schools including Mast Way School, Oyster River Middle School, and Oyster River High School.
Ownership History
We collect this data history from publicly available records. To have your information removed, we recommend requesting removal directly through your county’s website.
Purchase Details
Home Financials for this Owner
Home Financials are based on the most recent Mortgage that was taken out on this home.Home Values in the Area
Average Home Value in this Area
Purchase History
We collect this data history from publicly available records. To have your information removed, we recommend requesting removal directly through your county’s website.
| Date | Buyer | Sale Price | Title Company |
|---|---|---|---|
| $240,000 | -- | ||
| $240,000 | -- |
Mortgage History
We collect this data history from publicly available records. To have your information removed, we recommend requesting removal directly through your county’s website.
| Date | Status | Borrower | Loan Amount |
|---|---|---|---|
| Open | $23,200 | ||
| Open | $162,001 | ||
| Closed | $162,001 |
Tax History
We collect this data history from publicly available records. To have your information removed, we recommend requesting removal directly through your county’s website.
| Year | Tax Paid | Tax Assessment Tax Assessment Total Assessment is a certain percentage of the fair market value that is determined by local assessors to be the total taxable value of land and additions on the property. | Land | Improvement |
|---|---|---|---|---|
| 2025 | $12,115 | $642,000 | $291,200 | $350,800 |
| 2024 | $10,761 | $529,300 | $204,400 | $324,900 |
| 2023 | $10,840 | $529,300 | $204,400 | $324,900 |
| 2022 | $9,220 | $317,500 | $136,300 | $181,200 |
| 2021 | $8,867 | $317,700 | $136,500 | $181,200 |
| 2020 | $8,810 | $317,700 | $136,500 | $181,200 |
| 2019 | $8,715 | $317,700 | $136,500 | $181,200 |
| 2018 | $8,514 | $317,700 | $136,500 | $181,200 |
| 2017 | $8,117 | $264,900 | $104,900 | $160,000 |
| 2016 | $7,875 | $264,900 | $104,900 | $160,000 |
| 2015 | $7,907 | $264,900 | $104,900 | $160,000 |
| 2014 | $8,085 | $264,900 | $104,900 | $160,000 |
| 2013 | $8,056 | $264,900 | $104,900 | $160,000 |
Map
- 51 Sandy Brook Dr
- 1 Denbow Rd
- 55 Ross Rd
- 27 Ross Rd
- 8 Orchard Dr
- 15 Oyster River Rd
- 8 Old Landing Rd
- 21 Park Ct
- 9 Young Dr
- 10 Young Dr
- 1 Riverview Ct
- 3 Wade Farm Rd Unit A
- 1 Woodridge Rd
- 4 Moharinet Way
- 1014 Strafford Ave
- 367 Durham Point Rd
- 402 Bay Rd
- 4 Bartlett Rd
- 75 Piscataqua Rd
- 53/53A Bagdad Rd
Ask me questions while you tour the home.