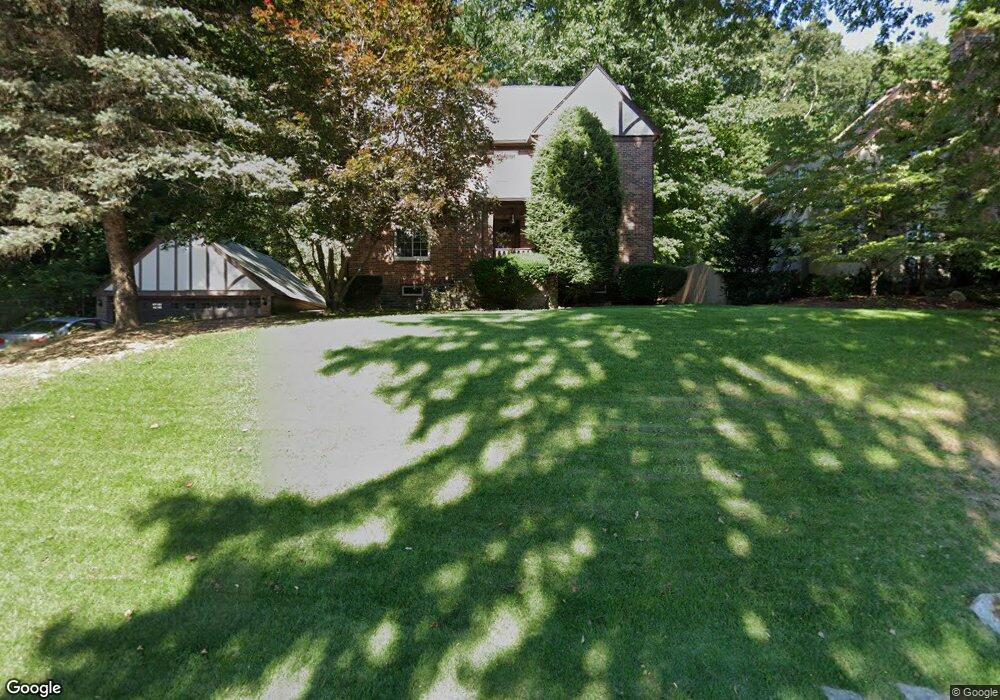
38 Flagg St Worcester, MA 01602
Salisbury Street NeighborhoodEstimated Value: $580,000 - $659,118
5
Beds
3
Baths
2,128
Sq Ft
$294/Sq Ft
Est. Value
About This Home
This home is located at 38 Flagg St, Worcester, MA 01602 and is currently estimated at $626,030, approximately $294 per square foot. 38 Flagg St is a home located in Worcester County with nearby schools including Chandler Magnet, Jacob Hiatt Magnet School, and Flagg Street School.
Ownership History
Date
Name
Owned For
Owner Type
Purchase Details
Closed on
Nov 8, 1996
Sold by
Standard Federal Bk
Bought by
Frigioiu Florica
Current Estimated Value
Home Financials for this Owner
Home Financials are based on the most recent Mortgage that was taken out on this home.
Original Mortgage
$97,200
Interest Rate
8.1%
Mortgage Type
Purchase Money Mortgage
Purchase Details
Closed on
Feb 27, 1989
Sold by
Schmidt J Kevin
Bought by
Pinchover Moshe
Create a Home Valuation Report for This Property
The Home Valuation Report is an in-depth analysis detailing your home's value as well as a comparison with similar homes in the area
Home Values in the Area
Average Home Value in this Area
Purchase History
| Date | Buyer | Sale Price | Title Company |
|---|---|---|---|
| Frigioiu Florica | $121,500 | -- | |
| Pinchover Moshe | $187,900 | -- |
Source: Public Records
Mortgage History
| Date | Status | Borrower | Loan Amount |
|---|---|---|---|
| Open | Pinchover Moshe | $46,100 | |
| Open | Pinchover Moshe | $110,000 | |
| Closed | Pinchover Moshe | $18,000 | |
| Closed | Pinchover Moshe | $97,200 |
Source: Public Records
Tax History
| Year | Tax Paid | Tax Assessment Tax Assessment Total Assessment is a certain percentage of the fair market value that is determined by local assessors to be the total taxable value of land and additions on the property. | Land | Improvement |
|---|---|---|---|---|
| 2025 | $7,972 | $604,400 | $123,500 | $480,900 |
| 2024 | $7,253 | $527,500 | $123,500 | $404,000 |
| 2023 | $7,005 | $488,500 | $106,400 | $382,100 |
| 2022 | $6,438 | $423,300 | $85,100 | $338,200 |
| 2021 | $6,380 | $391,900 | $68,100 | $323,800 |
| 2020 | $6,446 | $379,200 | $68,000 | $311,200 |
| 2019 | $6,480 | $360,000 | $65,500 | $294,500 |
| 2018 | $6,547 | $346,200 | $65,500 | $280,700 |
| 2017 | $6,185 | $321,800 | $65,500 | $256,300 |
| 2016 | $6,509 | $315,800 | $53,600 | $262,200 |
| 2015 | $4,305 | $214,500 | $53,600 | $160,900 |
| 2014 | $4,191 | $214,500 | $53,600 | $160,900 |
Source: Public Records
Map
Nearby Homes
- 22 Audubon Rd
- 31 Lenox St
- 19 Kenilworth Rd
- 85 Camelot Dr Unit 118
- 18 Merlin Ct Unit 18
- 8 Modred Ct
- 23 Orrison St
- 1029 Pleasant St Unit 19
- 32 Aylesbury Rd
- 118 Beaconsfield Rd
- 12 Cardinal Rd
- 9 Dennison Rd
- 163 Moreland St
- 7 Longworth Rd
- 493 Salisbury St
- 18 Hadwen Ln
- 93 Newton Ave N
- 16 Sherwood Rd
- 83 Newton Ave N
- 8 Old Colony Rd
- 42 Flagg St
- 46 Flagg St
- 37 Flagg St
- 25 Rittenhouse Rd
- 41 Flagg St
- 50 Flagg St
- 2 High Ridge Rd
- 24 Rittenhouse Rd
- 114 Beeching St
- 112 Beeching St
- 21 Rittenhouse Rd
- 15 Gaskill Rd
- 99 Hillcrest Ave
- 52 Flagg St
- 110 Beeching St
- 17 Rittenhouse Rd
- 108 Beeching St
- 115 Beeching St
- 14 High Ridge Rd
- 96 Hillcrest Ave
Your Personal Tour Guide
Ask me questions while you tour the home.