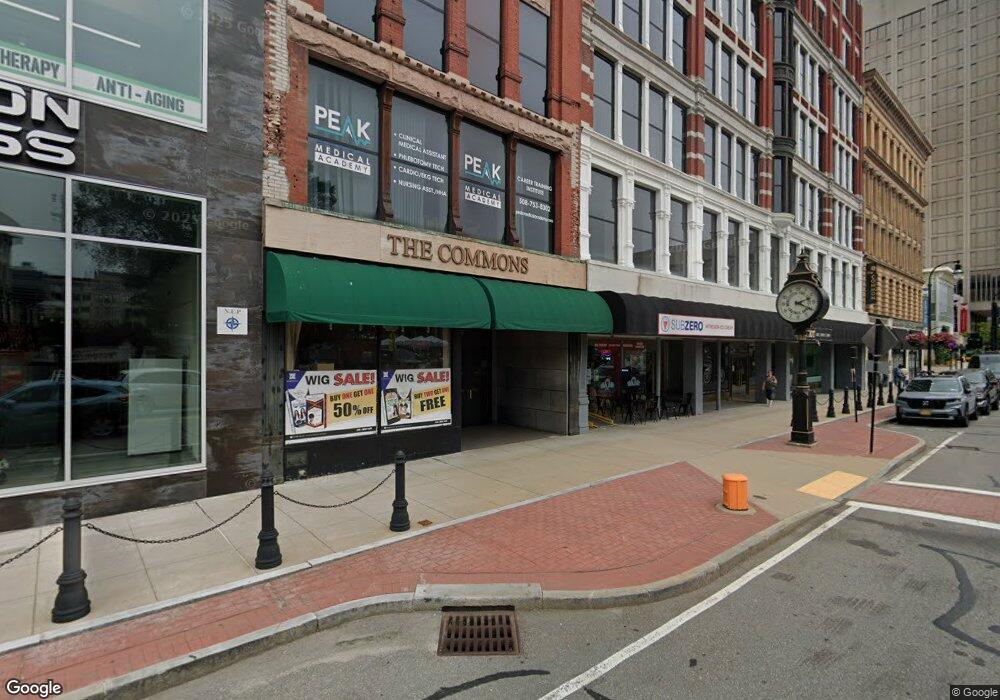
38 Front St Unit 5 Worcester, MA 01608
Downtown Worcester NeighborhoodEstimated Value: $564,573
Studio
--
Bath
3,853
Sq Ft
$147/Sq Ft
Est. Value
About This Home
This home is located at 38 Front St Unit 5, Worcester, MA 01608 and is currently estimated at $564,573, approximately $146 per square foot. 38 Front St Unit 5 is a home located in Worcester County with nearby schools including City View, Jacob Hiatt Magnet School, and Chandler Magnet.
Ownership History
Date
Name
Owned For
Owner Type
Purchase Details
Closed on
Nov 19, 2010
Sold by
38 Front St Llc
Bought by
Jenhyl Prop Llc
Current Estimated Value
Home Financials for this Owner
Home Financials are based on the most recent Mortgage that was taken out on this home.
Original Mortgage
$199,500
Outstanding Balance
$131,828
Interest Rate
4.3%
Mortgage Type
Commercial
Estimated Equity
$432,745
Create a Home Valuation Report for This Property
The Home Valuation Report is an in-depth analysis detailing your home's value as well as a comparison with similar homes in the area
Home Values in the Area
Average Home Value in this Area
Purchase History
| Date | Buyer | Sale Price | Title Company |
|---|---|---|---|
| Jenhyl Prop Llc | $249,000 | -- |
Source: Public Records
Mortgage History
| Date | Status | Borrower | Loan Amount |
|---|---|---|---|
| Open | Jenhyl Prop Llc | $199,500 |
Source: Public Records
Tax History
| Year | Tax Paid | Tax Assessment Tax Assessment Total Assessment is a certain percentage of the fair market value that is determined by local assessors to be the total taxable value of land and additions on the property. | Land | Improvement |
|---|---|---|---|---|
| 2025 | $10,065 | $351,800 | $108,000 | $243,800 |
| 2024 | $11,481 | $382,200 | $108,000 | $274,200 |
| 2023 | $12,357 | $395,300 | $93,900 | $301,400 |
| 2022 | $12,739 | $382,200 | $93,900 | $288,300 |
| 2021 | $12,022 | $332,100 | $71,700 | $260,400 |
| 2020 | $11,677 | $332,100 | $71,700 | $260,400 |
| 2019 | $11,269 | $322,900 | $71,700 | $251,200 |
| 2018 | $10,675 | $313,700 | $71,700 | $242,000 |
| 2017 | $10,330 | $313,700 | $71,700 | $242,000 |
| 2016 | $10,201 | $300,200 | $69,600 | $230,600 |
| 2015 | $9,525 | $300,200 | $69,600 | $230,600 |
| 2014 | $9,255 | $300,200 | $69,600 | $230,600 |
Source: Public Records
Map
Nearby Homes
- 17 Federal St Unit 210
- 531 Main St Unit 403
- 22 Elm St Unit 402
- 22 Elm St Unit 110
- 22 Elm St Unit 412
- 34 Elm St
- 6 Chatham Place Unit 6
- 70 Southbridge St Unit 611
- 70 Southbridge St Unit 310
- 70 Southbridge St Unit 703
- 14 Ashland St Unit 2R
- 64 Green St
- 56 Elm St Unit 2
- 29 William St Unit 22
- 8 Crown St
- 13 West St
- 5 State St Unit 1
- 38 1/2 Bowdoin St
- 80 Mulberry St
- 21 Fruit St
- 38 Front St Unit 2 & 5
- 38 Front St Unit 3
- 38 Front St Unit two
- 38 Front St Unit 2
- 38 Front St
- 38 Front St Unit 4
- 44 Front St
- 40 Front St
- 17 Mechanic St Unit 200
- 17 Mechanic St Unit 300
- 250 Commercial St
- 27 Mechanic St Unit 101
- 27 Mechanic St Unit 103
- 27 Mechanic St Unit 202
- 27-29 Mechanic St Unit 101
- 27-29 Mechanic St
- 27 Mechanic St
- 50 Front St
- 10 Front St Unit 5th floor
- 22 Front St Unit 200
Your Personal Tour Guide
Ask me questions while you tour the home.