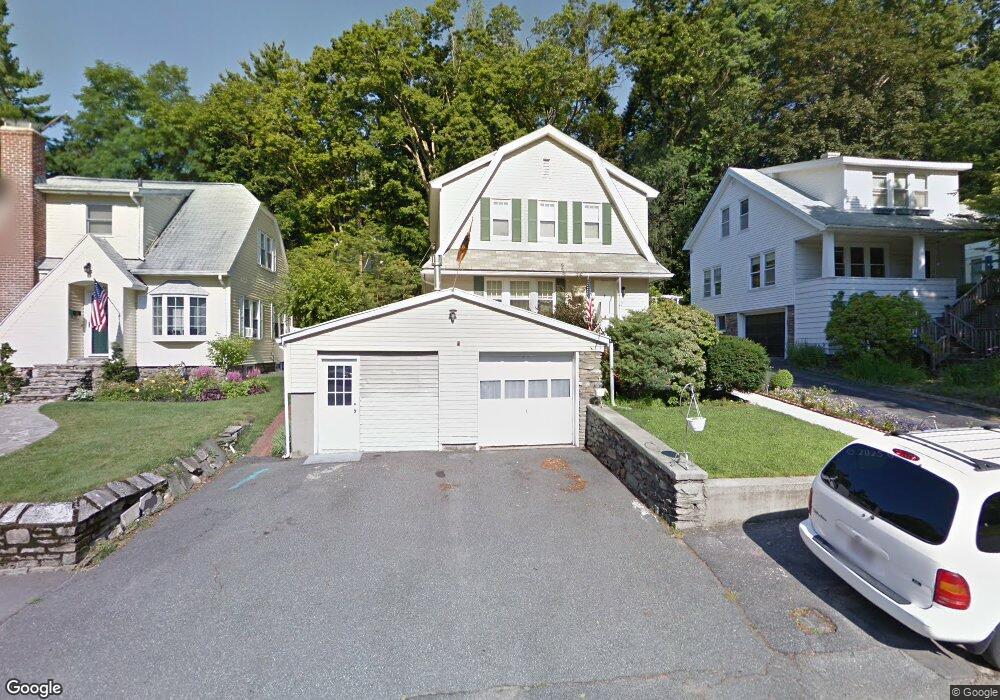
38 Hadwen Ln Worcester, MA 01602
Newton Square NeighborhoodEstimated Value: $488,000 - $530,000
3
Beds
3
Baths
1,850
Sq Ft
$272/Sq Ft
Est. Value
About This Home
This home is located at 38 Hadwen Ln, Worcester, MA 01602 and is currently estimated at $503,971, approximately $272 per square foot. 38 Hadwen Ln is a home located in Worcester County with nearby schools including Chandler Magnet, Jacob Hiatt Magnet School, and Midland Street.
Ownership History
Date
Name
Owned For
Owner Type
Purchase Details
Closed on
Nov 28, 2017
Sold by
Sholla Steve and Sholla Daniela
Bought by
Sholla Steve and Sholla Danela
Current Estimated Value
Purchase Details
Closed on
Jan 16, 2004
Sold by
Blake-Johnson Diane R and Blake-Johnson Gregory V
Bought by
Sholla Stavri
Home Financials for this Owner
Home Financials are based on the most recent Mortgage that was taken out on this home.
Original Mortgage
$160,000
Interest Rate
5.98%
Mortgage Type
Purchase Money Mortgage
Purchase Details
Closed on
Mar 12, 1999
Sold by
Anderson Claire M
Bought by
Johnson Gregory and Johnson Diane R
Home Financials for this Owner
Home Financials are based on the most recent Mortgage that was taken out on this home.
Original Mortgage
$145,000
Interest Rate
6.73%
Mortgage Type
Purchase Money Mortgage
Create a Home Valuation Report for This Property
The Home Valuation Report is an in-depth analysis detailing your home's value as well as a comparison with similar homes in the area
Home Values in the Area
Average Home Value in this Area
Purchase History
| Date | Buyer | Sale Price | Title Company |
|---|---|---|---|
| Sholla Steve | -- | -- | |
| Sholla Stavri | $251,000 | -- | |
| Johnson Gregory | $155,000 | -- |
Source: Public Records
Mortgage History
| Date | Status | Borrower | Loan Amount |
|---|---|---|---|
| Previous Owner | Sholla Stavri | $160,000 | |
| Previous Owner | Johnson Gregory | $145,000 |
Source: Public Records
Tax History Compared to Growth
Tax History
| Year | Tax Paid | Tax Assessment Tax Assessment Total Assessment is a certain percentage of the fair market value that is determined by local assessors to be the total taxable value of land and additions on the property. | Land | Improvement |
|---|---|---|---|---|
| 2025 | $5,339 | $404,800 | $117,700 | $287,100 |
| 2024 | $5,121 | $372,400 | $117,700 | $254,700 |
| 2023 | $4,929 | $343,700 | $102,300 | $241,400 |
| 2022 | $4,558 | $299,700 | $81,900 | $217,800 |
| 2021 | $4,549 | $279,400 | $65,500 | $213,900 |
| 2020 | $4,337 | $255,100 | $65,500 | $189,600 |
| 2019 | $4,178 | $232,100 | $58,900 | $173,200 |
| 2018 | $4,177 | $220,900 | $58,900 | $162,000 |
| 2017 | $4,004 | $208,300 | $58,900 | $149,400 |
| 2016 | $3,988 | $193,500 | $42,800 | $150,700 |
| 2015 | $3,884 | $193,500 | $42,800 | $150,700 |
| 2014 | $3,717 | $190,200 | $42,800 | $147,400 |
Source: Public Records
Map
Nearby Homes
- 40 Howland Terrace
- 53 Howland Terrace
- 16 Sherwood Rd
- 96 June St Unit 3
- 83 Commodore Rd
- 2 Carlisle St
- 6 Newton Ave
- 9 Field Way
- 371 Chandler St Unit 2
- 250 May St
- 19 Kenilworth Rd
- 3 Suburban Rd
- 346 Lovell St
- 4 Longfellow Rd
- 7 Longworth Rd
- 5 Coombs Rd
- 18 Zenith Dr
- 31 Lenox St
- 30 Kinnicutt Rd
- 5 Manila St