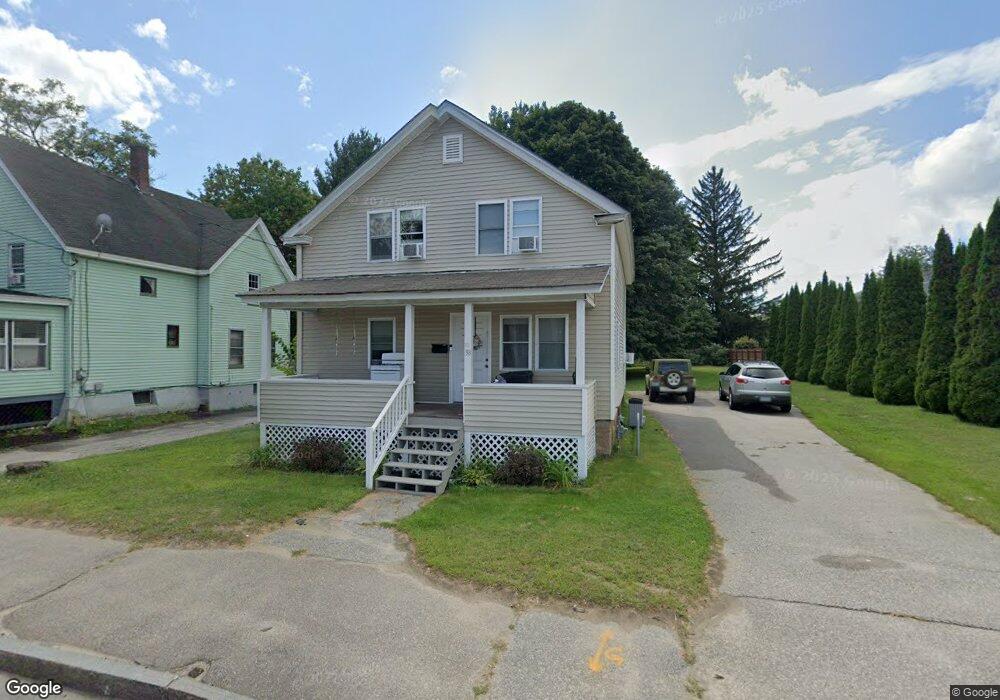
38 Hall St Concord, NH 03301
South End NeighborhoodEstimated Value: $339,973
3
Beds
2
Baths
1,240
Sq Ft
$274/Sq Ft
Est. Value
About This Home
This home is located at 38 Hall St, Concord, NH 03301 and is currently estimated at $339,973, approximately $274 per square foot. 38 Hall St is a home located in Merrimack County with nearby schools including Abbot-Downing School, Rundlett Middle School, and Concord High School.
Ownership History
Date
Name
Owned For
Owner Type
Purchase Details
Closed on
Jul 18, 2023
Sold by
D & S Savoy Llc
Bought by
Rios Brendan J and Carter Samantha R
Current Estimated Value
Home Financials for this Owner
Home Financials are based on the most recent Mortgage that was taken out on this home.
Original Mortgage
$294,566
Outstanding Balance
$287,539
Interest Rate
6.79%
Mortgage Type
FHA
Estimated Equity
$52,434
Purchase Details
Closed on
May 28, 2004
Sold by
Pasquale F Alosa T
Bought by
D Savoy Llc and S Savoy Llc
Create a Home Valuation Report for This Property
The Home Valuation Report is an in-depth analysis detailing your home's value as well as a comparison with similar homes in the area
Home Values in the Area
Average Home Value in this Area
Purchase History
| Date | Buyer | Sale Price | Title Company |
|---|---|---|---|
| Rios Brendan J | $300,000 | None Available | |
| D Savoy Llc | $150,000 | -- |
Source: Public Records
Mortgage History
| Date | Status | Borrower | Loan Amount |
|---|---|---|---|
| Open | Rios Brendan J | $294,566 |
Source: Public Records
Tax History Compared to Growth
Tax History
| Year | Tax Paid | Tax Assessment Tax Assessment Total Assessment is a certain percentage of the fair market value that is determined by local assessors to be the total taxable value of land and additions on the property. | Land | Improvement |
|---|---|---|---|---|
| 2024 | $5,574 | $201,300 | $113,500 | $87,800 |
| 2023 | $5,407 | $201,300 | $113,500 | $87,800 |
| 2022 | $5,212 | $201,300 | $113,500 | $87,800 |
| 2021 | $5,057 | $201,300 | $113,500 | $87,800 |
| 2020 | $5,272 | $197,000 | $113,500 | $83,500 |
| 2019 | $5,109 | $183,900 | $113,500 | $70,400 |
| 2018 | $5,060 | $179,500 | $113,500 | $66,000 |
| 2017 | $4,950 | $175,300 | $113,500 | $61,800 |
| 2016 | $4,734 | $171,100 | $113,500 | $57,600 |
| 2015 | $4,640 | $169,700 | $113,500 | $56,200 |
| 2014 | $4,550 | $169,700 | $113,500 | $56,200 |
| 2013 | $4,328 | $169,200 | $113,500 | $55,700 |
| 2012 | $4,250 | $174,400 | $113,500 | $60,900 |
Source: Public Records
Map
Nearby Homes
- 105 S Main St
- 24 Badger St
- 33 Spruce St
- 0 Spruce St Unit 88
- 14 Downing St
- 10 Perley St
- 14-16 Perley St
- 75 S State St
- 87 S Main St Unit 2
- 41 Longmeadow Dr
- 22 Longmeadow Dr
- 122 South St
- 12 Avon St
- 47 South St
- 69 Manchester St Unit Lot 18
- 376 S Main St
- 0 South St Unit 4969509
- 4 Fayette St
- 9 Strawberry Ln
- 15 Bridle Path Trail