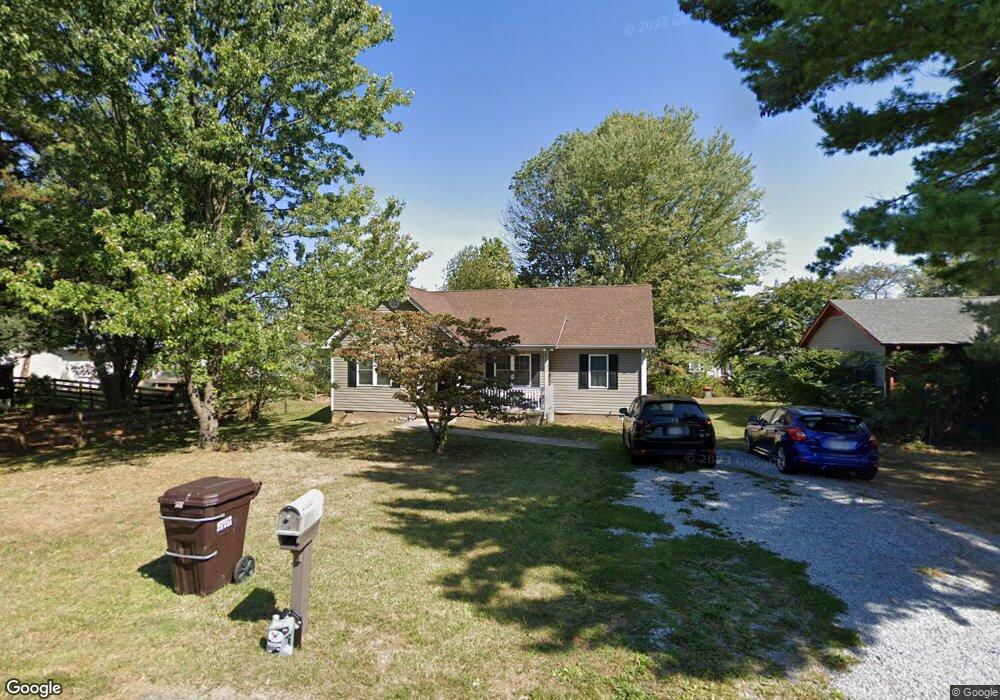
38 Hayrick Rd Waynesboro, VA 22980
Estimated Value: $281,000 - $301,000
3
Beds
2
Baths
1,226
Sq Ft
$237/Sq Ft
Est. Value
About This Home
This home is located at 38 Hayrick Rd, Waynesboro, VA 22980 and is currently estimated at $290,137, approximately $236 per square foot. 38 Hayrick Rd is a home located in Augusta County with nearby schools including Stuarts Draft Elementary School, Stuarts Draft Middle School, and Stuarts Draft High School.
Ownership History
Date
Name
Owned For
Owner Type
Purchase Details
Closed on
Dec 13, 2017
Sold by
Wheeler Joshua A and Wheeler Bethanne C
Bought by
Key Matthew W and Shumaker Molly R
Current Estimated Value
Purchase Details
Closed on
Mar 1, 2016
Sold by
Carter Cody A and Carter Chelsea C
Bought by
Wheeler Joshua A and Wheeler Bethanne C
Home Financials for this Owner
Home Financials are based on the most recent Mortgage that was taken out on this home.
Original Mortgage
$168,547
Interest Rate
3.72%
Mortgage Type
VA
Purchase Details
Closed on
May 9, 2013
Sold by
Ea Homes Inc A Virginia Corporation
Bought by
Carter Cody A and Carter Chelsea C
Home Financials for this Owner
Home Financials are based on the most recent Mortgage that was taken out on this home.
Original Mortgage
$153,061
Interest Rate
3.57%
Mortgage Type
New Conventional
Create a Home Valuation Report for This Property
The Home Valuation Report is an in-depth analysis detailing your home's value as well as a comparison with similar homes in the area
Home Values in the Area
Average Home Value in this Area
Purchase History
| Date | Buyer | Sale Price | Title Company |
|---|---|---|---|
| Key Matthew W | $168,000 | -- | |
| Wheeler Joshua A | $165,000 | Attorney | |
| Carter Cody A | $150,000 | Attorney |
Source: Public Records
Mortgage History
| Date | Status | Borrower | Loan Amount |
|---|---|---|---|
| Previous Owner | Wheeler Joshua A | $168,547 | |
| Previous Owner | Carter Cody A | $153,061 |
Source: Public Records
Tax History Compared to Growth
Tax History
| Year | Tax Paid | Tax Assessment Tax Assessment Total Assessment is a certain percentage of the fair market value that is determined by local assessors to be the total taxable value of land and additions on the property. | Land | Improvement |
|---|---|---|---|---|
| 2025 | $1,301 | $250,200 | $55,000 | $195,200 |
| 2024 | $1,321 | $254,000 | $55,000 | $199,000 |
| 2023 | $1,017 | $161,400 | $48,000 | $113,400 |
| 2022 | $1,017 | $161,400 | $48,000 | $113,400 |
| 2021 | $1,017 | $161,400 | $48,000 | $113,400 |
| 2020 | $1,017 | $161,400 | $48,000 | $113,400 |
| 2019 | $1,017 | $161,400 | $48,000 | $113,400 |
| 2018 | $939 | $149,131 | $48,000 | $101,131 |
| 2017 | $865 | $149,131 | $48,000 | $101,131 |
| 2016 | $865 | $149,131 | $48,000 | $101,131 |
| 2015 | $192 | $149,131 | $48,000 | $101,131 |
| 2014 | $192 | $149,131 | $48,000 | $101,131 |
| 2013 | $192 | $113,900 | $50,000 | $63,900 |
Source: Public Records
Map
Nearby Homes
- 634 Augusta Farms Rd
- 197 Sherwood Dr
- TBD Sweet Oaks Ln
- 3318 Stuarts Draft Hwy
- 62 Fossil Dr
- 68 Fossil Dr
- 66 Fossil Dr
- 45 Gemstone Dr
- 176 Locust Grove Ln
- TBD Tinkling Spring Rd
- 81 Meriwether Cir
- 51 Meriwether Cir
- 2735 Stuarts Draft Hwy
- 1040 Tinkling Spring Rd
- Lot M-12 Ivy Ridge Ln
- Lot C-1 Ivy Ridge Ln
- 10 Silver Maple Cove
- 00 Lipscomb Rd
- TBD7 Ladd Rd
- TBD6 Ladd Rd
- 38 Hayrick Rd
- 46 Hayrick Rd
- 21 Stubblefield Rd
- 18 Buckboard Rd
- 9 Stubblefield Rd
- 25 Stubblefield Rd
- 35 Hayrick Rd
- 24 Buckboard Rd
- 43 Hayrick Rd
- 31 Stubblefield Rd
- 58 Hayrick Rd
- 25 Hayrick Rd
- 53 Hayrick Rd
- 13 Buckboard Rd
- 26 Buckboard Rd
- 37 Stubblefield Rd
- 12 Stubblefield Rd
- 20 Stubblefield Rd
- 24 Stubblefield Rd
- 19 Buckboard Rd