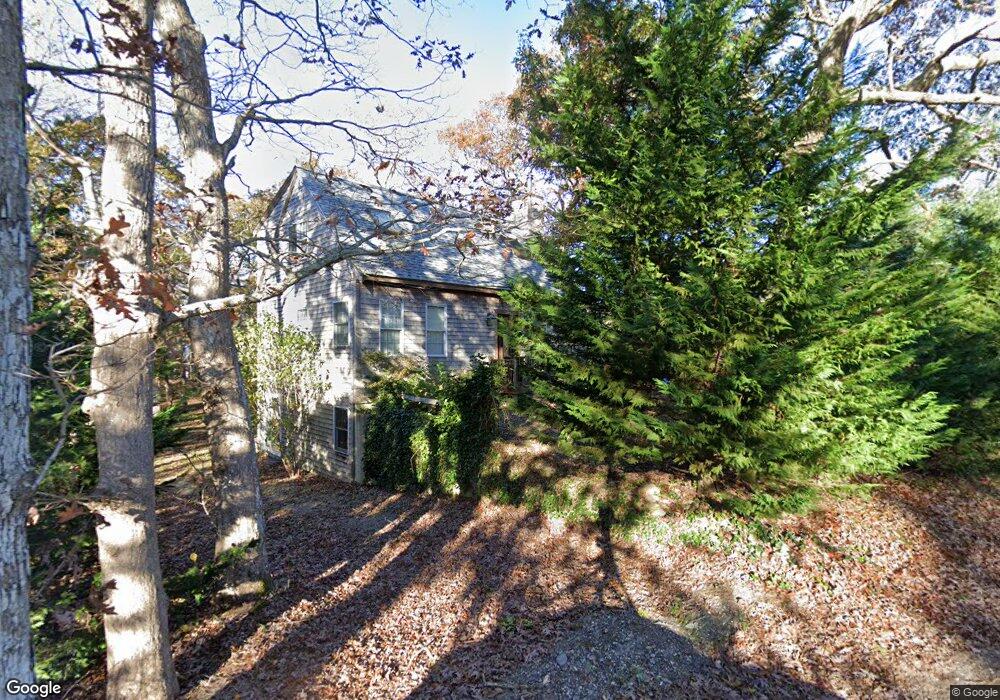
38 Herring Creek Rd Vineyard Haven, MA 02568
Vineyard Haven NeighborhoodEstimated Value: $1,287,000 - $1,417,000
3
Beds
3
Baths
1,580
Sq Ft
$848/Sq Ft
Est. Value
About This Home
This home is located at 38 Herring Creek Rd, Vineyard Haven, MA 02568 and is currently estimated at $1,340,595, approximately $848 per square foot. 38 Herring Creek Rd is a home located in Dukes County with nearby schools including Tisbury Elementary School, Martha's Vineyard Regional High School, and Vineyard Montessori School.
Ownership History
Date
Name
Owned For
Owner Type
Purchase Details
Closed on
Oct 2, 2003
Sold by
Menton Julia and Menton Paul
Bought by
Douglas Jamie M
Current Estimated Value
Home Financials for this Owner
Home Financials are based on the most recent Mortgage that was taken out on this home.
Original Mortgage
$367,200
Interest Rate
6.25%
Mortgage Type
Purchase Money Mortgage
Purchase Details
Closed on
Sep 19, 2003
Sold by
Menton Julia and Menton Paul
Bought by
Campbell Dorothy T
Home Financials for this Owner
Home Financials are based on the most recent Mortgage that was taken out on this home.
Original Mortgage
$367,200
Interest Rate
6.25%
Mortgage Type
Purchase Money Mortgage
Purchase Details
Closed on
Jul 27, 1998
Sold by
Stone Julia S
Bought by
Menton Paul and Menton Julia
Create a Home Valuation Report for This Property
The Home Valuation Report is an in-depth analysis detailing your home's value as well as a comparison with similar homes in the area
Home Values in the Area
Average Home Value in this Area
Purchase History
| Date | Buyer | Sale Price | Title Company |
|---|---|---|---|
| Douglas Jamie M | $432,000 | -- | |
| Campbell Dorothy T | -- | -- | |
| Menton Paul | $64,000 | -- |
Source: Public Records
Mortgage History
| Date | Status | Borrower | Loan Amount |
|---|---|---|---|
| Open | Menton Paul | $348,000 | |
| Closed | Menton Paul | $367,200 | |
| Previous Owner | Menton Paul | $322,000 |
Source: Public Records
Tax History Compared to Growth
Tax History
| Year | Tax Paid | Tax Assessment Tax Assessment Total Assessment is a certain percentage of the fair market value that is determined by local assessors to be the total taxable value of land and additions on the property. | Land | Improvement |
|---|---|---|---|---|
| 2025 | $8,440 | $1,114,900 | $560,100 | $554,800 |
| 2024 | $7,476 | $936,900 | $466,800 | $470,100 |
| 2023 | $6,139 | $838,700 | $386,600 | $452,100 |
| 2022 | $6,187 | $711,100 | $288,000 | $423,100 |
| 2021 | $5,529 | $602,900 | $288,000 | $314,900 |
| 2020 | $5,747 | $616,000 | $310,100 | $305,900 |
| 2019 | $5,649 | $616,000 | $310,100 | $305,900 |
| 2018 | $4,835 | $511,600 | $272,300 | $239,300 |
| 2017 | $4,224 | $463,700 | $254,100 | $209,600 |
| 2016 | $4,201 | $458,600 | $245,700 | $212,900 |
| 2015 | $4,059 | $455,000 | $258,500 | $196,500 |
Source: Public Records
Map
Nearby Homes
- 56 Herring Creek Rd
- 186 Franklin Terrace
- 186 Franklin Terrace
- 25 Herring Creek Rd
- 26 Herring Creek Rd
- 62 Herring Creek Rd
- 181 Franklin Terrace
- 18 Herring Creek Rd
- 15 Herring Creek Rd
- 8 W Tashmoo Ave
- 14 Herring Creek Rd
- 171 Franklin Terrace
- 17 Irenes Way
- 245 Greenwood Ave
- 246 Tashmoo Ave
- 170 Franklin Terrace
- 25 Irenes Way Unit 2
- 25 Irenes Way Unit 1
- 16 W Tashmoo Ave
- 18 Irenes Way