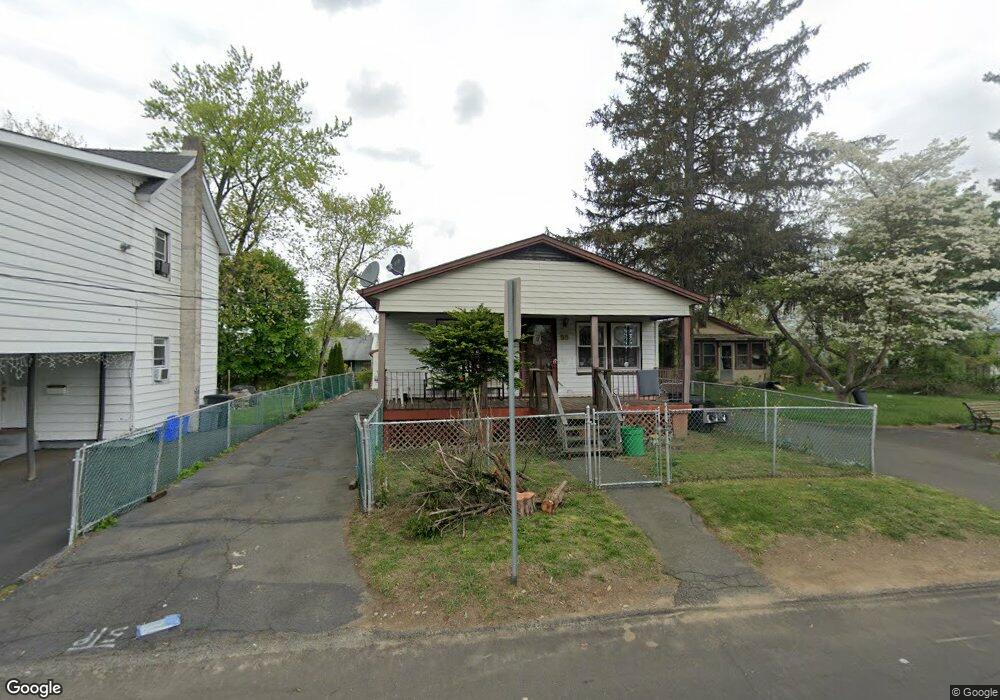
38 High St Garnerville, NY 10923
Estimated Value: $434,742 - $511,000
2
Beds
1
Bath
912
Sq Ft
$514/Sq Ft
Est. Value
About This Home
This home is located at 38 High St, Garnerville, NY 10923 and is currently estimated at $468,936, approximately $514 per square foot. 38 High St is a home located in Rockland County with nearby schools including Haverstraw Elementary School, West Haverstraw Elementary School, and Fieldstone Secondary School.
Ownership History
Date
Name
Owned For
Owner Type
Purchase Details
Closed on
Sep 11, 2003
Sold by
Multani Raghbir Singh
Bought by
Multani Raghbir Singh and Kaur Gurmit
Current Estimated Value
Purchase Details
Closed on
Aug 30, 2002
Sold by
Abreu Francisco and Abreu Gloria
Bought by
Multani Raghbir Singh
Home Financials for this Owner
Home Financials are based on the most recent Mortgage that was taken out on this home.
Original Mortgage
$172,200
Outstanding Balance
$73,192
Interest Rate
6.48%
Estimated Equity
$395,744
Create a Home Valuation Report for This Property
The Home Valuation Report is an in-depth analysis detailing your home's value as well as a comparison with similar homes in the area
Home Values in the Area
Average Home Value in this Area
Purchase History
| Date | Buyer | Sale Price | Title Company |
|---|---|---|---|
| Multani Raghbir Singh | -- | -- | |
| Multani Raghbir Singh | $246,000 | -- |
Source: Public Records
Mortgage History
| Date | Status | Borrower | Loan Amount |
|---|---|---|---|
| Open | Multani Raghbir Singh | $172,200 |
Source: Public Records
Tax History Compared to Growth
Tax History
| Year | Tax Paid | Tax Assessment Tax Assessment Total Assessment is a certain percentage of the fair market value that is determined by local assessors to be the total taxable value of land and additions on the property. | Land | Improvement |
|---|---|---|---|---|
| 2024 | $11,521 | $162,400 | $71,300 | $91,100 |
| 2023 | $11,521 | $162,400 | $71,300 | $91,100 |
| 2022 | $1,768 | $162,400 | $71,300 | $91,100 |
| 2021 | $11,375 | $162,400 | $71,300 | $91,100 |
| 2020 | $7,277 | $162,400 | $71,300 | $91,100 |
| 2019 | $1,712 | $162,400 | $71,300 | $91,100 |
| 2018 | $5,282 | $162,400 | $71,300 | $91,100 |
| 2017 | $8,346 | $162,400 | $71,300 | $91,100 |
| 2016 | $8,329 | $162,400 | $71,300 | $91,100 |
| 2015 | -- | $162,400 | $71,300 | $91,100 |
| 2014 | -- | $162,400 | $71,300 | $91,100 |
Source: Public Records
Map
Nearby Homes