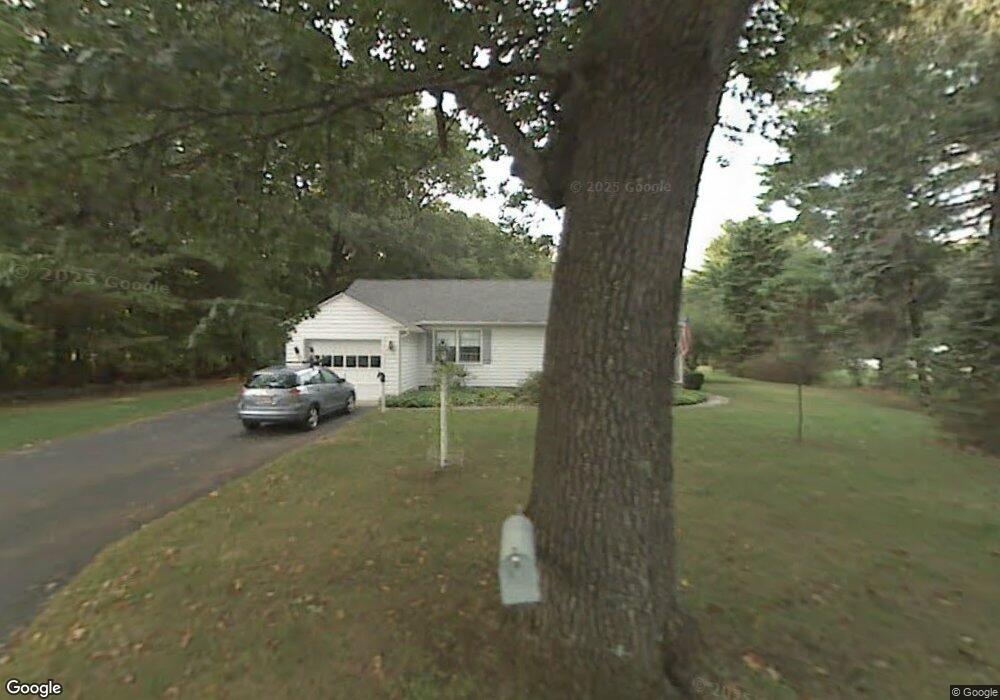
38 High St West Boylston, MA 01583
Estimated Value: $467,126 - $516,000
2
Beds
1
Bath
1,117
Sq Ft
$440/Sq Ft
Est. Value
About This Home
This home is located at 38 High St, West Boylston, MA 01583 and is currently estimated at $491,282, approximately $439 per square foot. 38 High St is a home located in Worcester County with nearby schools including Major Edwards Elementary School and West Boylston Junior/Senior High School.
Ownership History
Date
Name
Owned For
Owner Type
Purchase Details
Closed on
Sep 29, 2017
Sold by
Hartleb Harcey H and Hartleb Marcia E
Bought by
Hartleb Meredith
Current Estimated Value
Create a Home Valuation Report for This Property
The Home Valuation Report is an in-depth analysis detailing your home's value as well as a comparison with similar homes in the area
Home Values in the Area
Average Home Value in this Area
Purchase History
| Date | Buyer | Sale Price | Title Company |
|---|---|---|---|
| Hartleb Meredith | -- | -- |
Source: Public Records
Tax History Compared to Growth
Tax History
| Year | Tax Paid | Tax Assessment Tax Assessment Total Assessment is a certain percentage of the fair market value that is determined by local assessors to be the total taxable value of land and additions on the property. | Land | Improvement |
|---|---|---|---|---|
| 2025 | $60 | $434,300 | $130,700 | $303,600 |
| 2024 | $5,950 | $402,600 | $132,900 | $269,700 |
| 2023 | $5,889 | $378,000 | $130,700 | $247,300 |
| 2022 | $5,610 | $317,300 | $130,700 | $186,600 |
| 2021 | $7,008 | $278,700 | $108,000 | $170,700 |
| 2020 | $5,056 | $272,100 | $108,000 | $164,100 |
| 2019 | $4,773 | $253,200 | $108,000 | $145,200 |
| 2018 | $3,633 | $244,400 | $108,000 | $136,400 |
| 2017 | $3,413 | $213,400 | $108,000 | $105,400 |
| 2016 | $3,869 | $209,700 | $100,600 | $109,100 |
| 2015 | $3,723 | $203,000 | $99,800 | $103,200 |
Source: Public Records
Map
Nearby Homes
- 16 N Main St
- 26 Townsend Dr
- 287 Laurel St
- 20 Winthrop St
- 136 Sterling St Unit A3
- 0 North St
- 156 Prospect St
- 0 Boutelle Rd
- Lot 1 Manning St
- 2 Lakeview Ave
- 18 Laurel Ave
- 61 Boutelle Rd
- 21 Myrtle Ave
- 152 Worcester St Unit 8
- 223 Worcester Rd
- 54 Maple St
- 62 Maple St
- 4 Jewett Rd Unit B
- 4 Jewett Rd Unit A
- 39 Davidson Rd