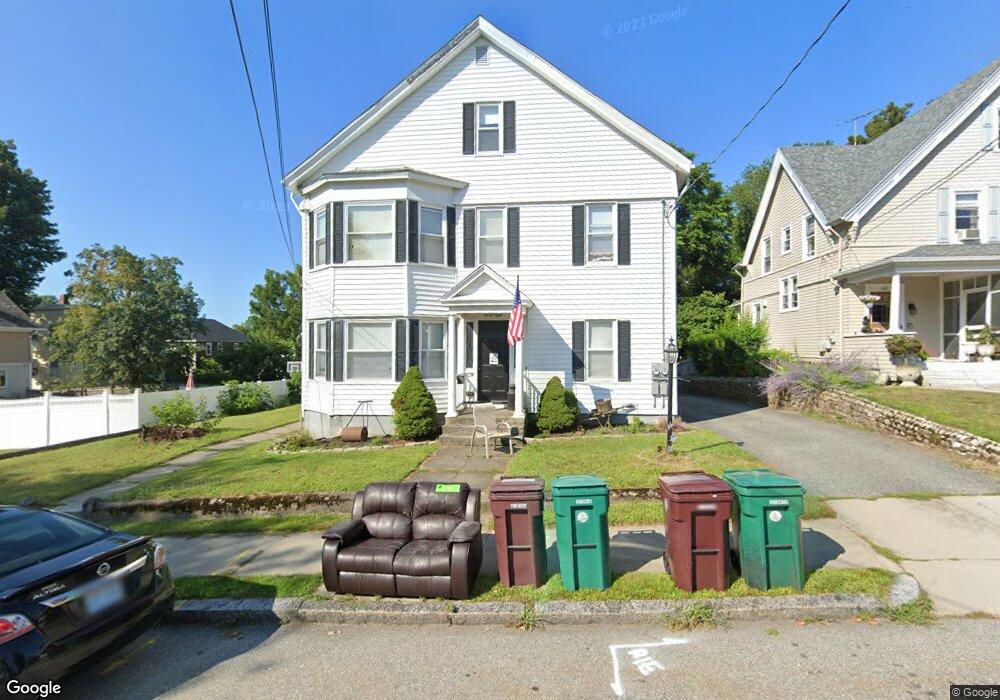
38 Highland St Woonsocket, RI 02895
North End NeighborhoodEstimated Value: $507,000 - $576,576
6
Beds
2
Baths
2,752
Sq Ft
$195/Sq Ft
Est. Value
About This Home
This home is located at 38 Highland St, Woonsocket, RI 02895 and is currently estimated at $537,894, approximately $195 per square foot. 38 Highland St is a home located in Providence County with nearby schools including Woonsocket High School, Rise Prep Mayoral Academy Middle School, and Rise Prep Mayoral Academy.
Ownership History
Date
Name
Owned For
Owner Type
Purchase Details
Closed on
Jun 8, 2004
Sold by
Johnson Leonard and Johnson Beverly J
Bought by
Payeur Michael and Payeur Julianne M
Current Estimated Value
Home Financials for this Owner
Home Financials are based on the most recent Mortgage that was taken out on this home.
Original Mortgage
$148,000
Interest Rate
5.94%
Mortgage Type
Purchase Money Mortgage
Purchase Details
Closed on
Feb 26, 1999
Sold by
Desjardins Bernard P
Bought by
Johnson Leonard and Johnson Beverly
Home Financials for this Owner
Home Financials are based on the most recent Mortgage that was taken out on this home.
Original Mortgage
$77,000
Interest Rate
6.78%
Mortgage Type
Purchase Money Mortgage
Create a Home Valuation Report for This Property
The Home Valuation Report is an in-depth analysis detailing your home's value as well as a comparison with similar homes in the area
Home Values in the Area
Average Home Value in this Area
Purchase History
| Date | Buyer | Sale Price | Title Company |
|---|---|---|---|
| Payeur Michael | $185,000 | -- | |
| Payeur Michael | $185,000 | -- | |
| Johnson Leonard | $110,000 | -- | |
| Johnson Leonard | $110,000 | -- |
Source: Public Records
Mortgage History
| Date | Status | Borrower | Loan Amount |
|---|---|---|---|
| Open | Johnson Leonard | $226,000 | |
| Closed | Johnson Leonard | $148,000 | |
| Previous Owner | Johnson Leonard | $77,000 |
Source: Public Records
Tax History
| Year | Tax Paid | Tax Assessment Tax Assessment Total Assessment is a certain percentage of the fair market value that is determined by local assessors to be the total taxable value of land and additions on the property. | Land | Improvement |
|---|---|---|---|---|
| 2025 | $6,850 | $610,000 | $104,700 | $505,300 |
| 2024 | $5,298 | $364,400 | $85,500 | $278,900 |
| 2023 | $5,094 | $364,400 | $85,500 | $278,900 |
| 2022 | $5,094 | $364,400 | $85,500 | $278,900 |
| 2021 | $4,254 | $179,100 | $66,400 | $112,700 |
| 2020 | $4,298 | $179,100 | $66,400 | $112,700 |
| 2018 | $4,313 | $179,100 | $66,400 | $112,700 |
| 2017 | $5,120 | $170,100 | $63,400 | $106,700 |
| 2016 | $5,416 | $170,100 | $63,400 | $106,700 |
| 2015 | $6,222 | $170,100 | $63,400 | $106,700 |
| 2014 | $6,059 | $168,600 | $69,800 | $98,800 |
Source: Public Records
Map
Nearby Homes
- 308 Harris Ave
- 58 Oakley Rd
- 36 Fairmount St
- 56 Winter St
- 154 156 Winter St
- 107 Blackstone St
- 115 Railroad St
- 187 Boyden St
- 458 Prospect St
- 83 Summer St
- 123 4th Ave
- 542 Prospect St
- 60 Fairlawn Ave
- 0 N Main St Unit 1401765
- 83 4th Ave
- 180 Allen St Unit 104
- 99 Allen St Unit 205
- 481 N Main St
- 0 Holbrook Ln Unit 1402850
- 10 Huntington Ave
- 48 Highland St
- 16 Highland St
- 37 Cold Spring Place
- 23 Cold Spring Place
- 47 Cold Spring Place
- 29 Cold Spring Place
- 60 Highland St
- 10 Highland St
- 17 Cold Spring Place
- 45 Highland St
- 7 Cold Spring Place
- 55 Highland St
- 48 Cold Spring Place
- 67 Highland St
- 567 Blackstone St Unit 3F
- 532 Blackstone St Unit 1
- 532 Blackstone St
- 36 Cold Spring Place
- 89 Highland St
- 94 Highland St
Your Personal Tour Guide
Ask me questions while you tour the home.