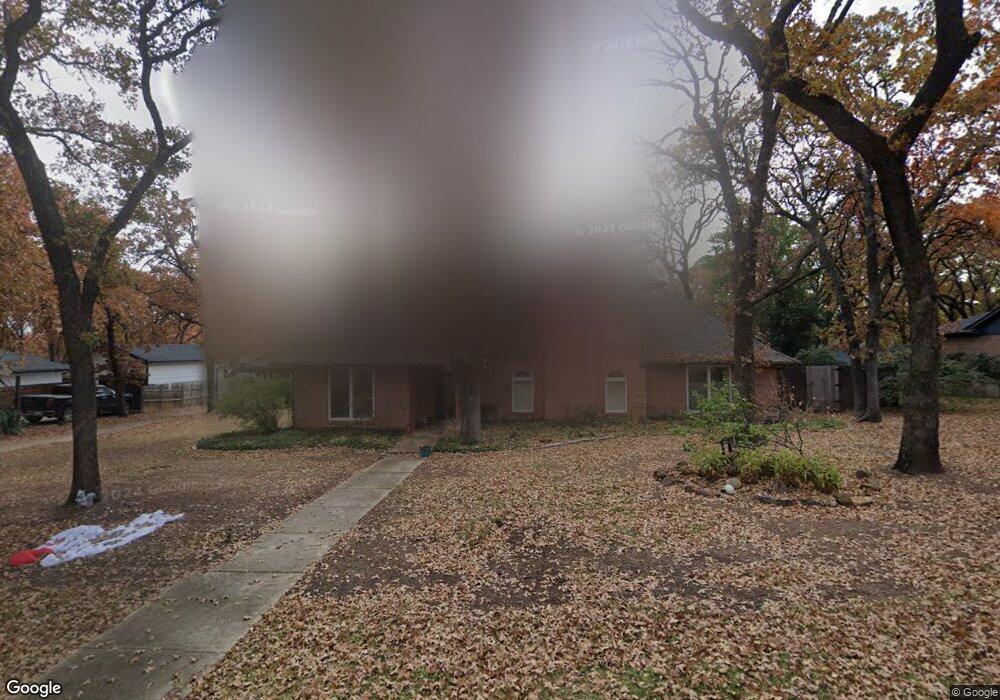
38 Highview Cir Denton, TX 76205
South Denton NeighborhoodEstimated Value: $624,000 - $670,000
4
Beds
3
Baths
3,058
Sq Ft
$210/Sq Ft
Est. Value
About This Home
This home is located at 38 Highview Cir, Denton, TX 76205 and is currently estimated at $643,343, approximately $210 per square foot. 38 Highview Cir is a home located in Denton County with nearby schools including Ryan Elementary School, McMath Middle School, and Denton High School.
Ownership History
Date
Name
Owned For
Owner Type
Purchase Details
Closed on
Jul 9, 2015
Sold by
Bennet Kristi L
Bought by
Roberts Aaron and Roberts Heather
Current Estimated Value
Home Financials for this Owner
Home Financials are based on the most recent Mortgage that was taken out on this home.
Original Mortgage
$297,400
Outstanding Balance
$231,002
Interest Rate
3.91%
Mortgage Type
New Conventional
Estimated Equity
$412,341
Purchase Details
Closed on
Feb 11, 2011
Sold by
Nolet Charles Noel
Bought by
Bennett Kristi L
Purchase Details
Closed on
Jul 12, 2005
Sold by
Federal Home Loan Mortgage Corporation
Bought by
Bennett Kristi and Nolet Charles
Home Financials for this Owner
Home Financials are based on the most recent Mortgage that was taken out on this home.
Original Mortgage
$185,600
Interest Rate
5.55%
Mortgage Type
Fannie Mae Freddie Mac
Purchase Details
Closed on
Jun 7, 2005
Sold by
Jackson Sherry D and Jackson David L
Bought by
Federal Home Loan Mortgage Corporation
Home Financials for this Owner
Home Financials are based on the most recent Mortgage that was taken out on this home.
Original Mortgage
$185,600
Interest Rate
5.55%
Mortgage Type
Fannie Mae Freddie Mac
Purchase Details
Closed on
Sep 21, 2000
Sold by
Putman Darren K
Bought by
Jackson Sherry D
Home Financials for this Owner
Home Financials are based on the most recent Mortgage that was taken out on this home.
Original Mortgage
$239,200
Interest Rate
7.95%
Purchase Details
Closed on
Oct 25, 1996
Sold by
Wilson Lisa M
Bought by
Putnam Darren K
Home Financials for this Owner
Home Financials are based on the most recent Mortgage that was taken out on this home.
Original Mortgage
$172,800
Interest Rate
3.95%
Purchase Details
Closed on
Jun 26, 1995
Sold by
Holcomb David Jackson
Bought by
Wilson Lisa M
Purchase Details
Closed on
Oct 28, 1994
Sold by
Gable Pamela Ingram
Bought by
Holcomb David Jackson
Home Financials for this Owner
Home Financials are based on the most recent Mortgage that was taken out on this home.
Original Mortgage
$13,000
Interest Rate
8.88%
Mortgage Type
Seller Take Back
Purchase Details
Closed on
Apr 15, 1994
Sold by
Gentry Robert W and Gentry Marilyn M
Bought by
Gable Pamela I and Holcomb David Jackson
Home Financials for this Owner
Home Financials are based on the most recent Mortgage that was taken out on this home.
Original Mortgage
$165,000
Interest Rate
7.49%
Create a Home Valuation Report for This Property
The Home Valuation Report is an in-depth analysis detailing your home's value as well as a comparison with similar homes in the area
Home Values in the Area
Average Home Value in this Area
Purchase History
| Date | Buyer | Sale Price | Title Company |
|---|---|---|---|
| Roberts Aaron | -- | None Available | |
| Bennett Kristi L | -- | None Available | |
| Bennett Kristi | -- | Rtt | |
| Federal Home Loan Mortgage Corporation | $170,000 | -- | |
| Jackson Sherry D | -- | -- | |
| Putnam Darren K | -- | -- | |
| Wilson Lisa M | -- | -- | |
| Wilson Lisa M | -- | -- | |
| Holcomb David Jackson | -- | -- | |
| Gable Pamela I | -- | -- |
Source: Public Records
Mortgage History
| Date | Status | Borrower | Loan Amount |
|---|---|---|---|
| Open | Roberts Aaron | $297,400 | |
| Previous Owner | Bennett Kristi | $185,600 | |
| Previous Owner | Jackson Sherry D | $239,200 | |
| Previous Owner | Putnam Darren K | $172,800 | |
| Previous Owner | Holcomb David Jackson | $13,000 | |
| Previous Owner | Gable Pamela I | $165,000 | |
| Closed | Putnam Darren K | $21,600 | |
| Closed | Jackson Sherry D | $195,000 | |
| Closed | Bennett Kristi | $46,400 | |
| Closed | Bennett Kristi L | $0 |
Source: Public Records
Tax History Compared to Growth
Tax History
| Year | Tax Paid | Tax Assessment Tax Assessment Total Assessment is a certain percentage of the fair market value that is determined by local assessors to be the total taxable value of land and additions on the property. | Land | Improvement |
|---|---|---|---|---|
| 2025 | $9,688 | $602,000 | $150,188 | $451,812 |
| 2024 | $10,886 | $563,990 | $0 | $0 |
| 2023 | $8,591 | $512,718 | $142,445 | $443,555 |
| 2022 | $9,895 | $466,107 | $108,469 | $430,619 |
| 2021 | $9,420 | $423,734 | $89,438 | $334,296 |
| 2020 | $9,714 | $425,000 | $89,438 | $335,562 |
| 2019 | $9,606 | $402,600 | $89,438 | $331,696 |
| 2018 | $8,841 | $366,000 | $89,438 | $276,562 |
| 2017 | $9,145 | $370,000 | $62,606 | $307,394 |
| 2016 | $9,136 | $369,628 | $62,606 | $307,022 |
| 2015 | $5,989 | $245,000 | $62,606 | $182,394 |
| 2014 | $5,989 | $250,000 | $62,606 | $187,394 |
| 2013 | -- | $249,923 | $62,606 | $187,317 |
Source: Public Records
Map
Nearby Homes
- 39 Highview Cir
- 28 Timbergreen Cir
- 3109 Forrestridge Dr
- 3200 Belmont St
- 9 Oak Forrest Cir
- 3309 Del Mar Dr
- 409 Meadowlands Dr
- 301 Fairmount Ct
- 100 Bentwood Ct
- 400 Regency Ct
- 33 Oak Forrest Cir
- 21 Wellington Oaks Cir
- 816 Chapel Dr
- 3601 Montecito Dr
- 824 Sandpiper Dr
- 821 Sandpiper Dr
- 9 Royal Oaks Cir
- 3108 Pinehurst Ct
- 3612 Granada Trail
- 829 Skylark Dr
- 40 Highview Cir
- 36 Highview Cir
- 7 Timbergreen Cir
- 5 Timbergreen Cir
- 9 Timbergreen Cir
- 37 Highview Cir
- 35 Highview Cir
- 34 Highview Cir
- 3 Timbergreen Cir
- 11 Timbergreen Cir
- 41 Highview Cir
- 33 Highview Cir
- 8 Highview Ct
- 10 Highview Ct
- 8 Timbergreen Cir
- 10 Timbergreen Cir
- 6 Timbergreen Cir
- 44 Highview Cir
- 32 Highview Cir
- 13 Timbergreen Cir