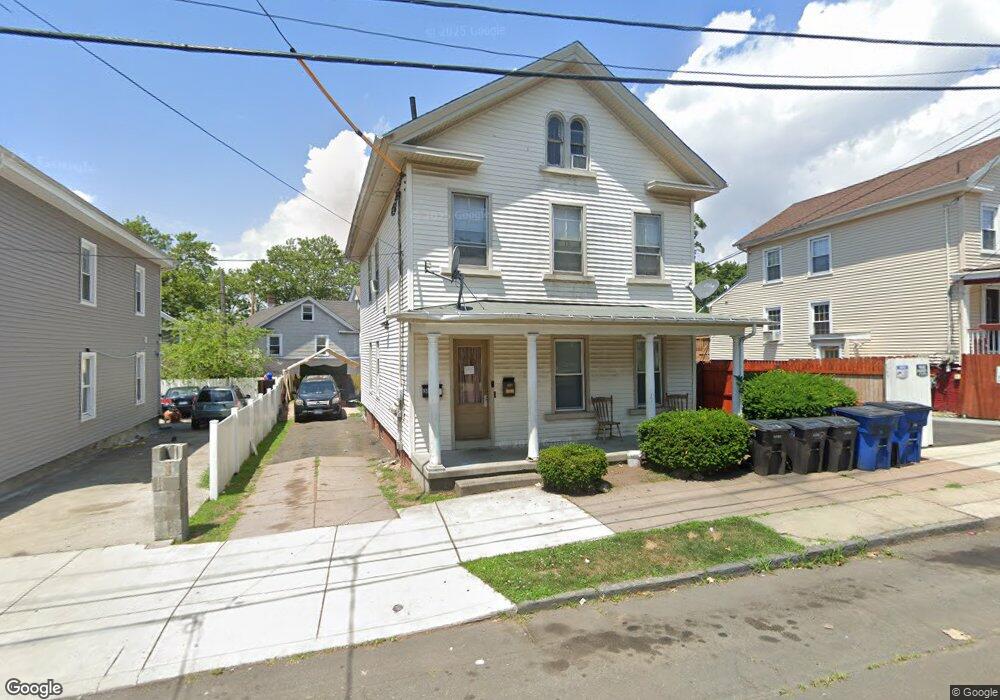
38 Houston St New Haven, CT 06513
Fair Haven NeighborhoodEstimated Value: $209,000 - $352,000
4
Beds
2
Baths
1,872
Sq Ft
$158/Sq Ft
Est. Value
About This Home
This home is located at 38 Houston St, New Haven, CT 06513 and is currently estimated at $296,542, approximately $158 per square foot. 38 Houston St is a home located in New Haven County with nearby schools including Fair Haven School, St Francis & St Rose Of Lima School, and Cold Spring School.
Ownership History
Date
Name
Owned For
Owner Type
Purchase Details
Closed on
Oct 10, 2018
Sold by
Netz Bonds New Haven 5
Bought by
Netz Bonds New Haven 5
Current Estimated Value
Purchase Details
Closed on
Mar 8, 2018
Sold by
Mms Investments Llc
Bought by
Netz Bonds New Haven 5
Purchase Details
Closed on
Jul 22, 1998
Sold by
Torello Pasquale and Milano Andrew
Bought by
Woodward Thomas D
Home Financials for this Owner
Home Financials are based on the most recent Mortgage that was taken out on this home.
Original Mortgage
$27,200
Interest Rate
6.99%
Mortgage Type
Unknown
Create a Home Valuation Report for This Property
The Home Valuation Report is an in-depth analysis detailing your home's value as well as a comparison with similar homes in the area
Home Values in the Area
Average Home Value in this Area
Purchase History
| Date | Buyer | Sale Price | Title Company |
|---|---|---|---|
| Netz Bonds New Haven 5 | -- | -- | |
| Netz Bonds New Haven 5 | $135,000 | -- | |
| Mms Investments Llc | $100,000 | -- | |
| Woodward Thomas D | -- | -- | |
| Woodward Thomas D | -- | -- | |
| Woodward Thomas D | $34,000 | -- |
Source: Public Records
Mortgage History
| Date | Status | Borrower | Loan Amount |
|---|---|---|---|
| Previous Owner | Woodward Thomas D | $125,000 | |
| Previous Owner | Woodward Thomas D | $27,200 |
Source: Public Records
Tax History Compared to Growth
Tax History
| Year | Tax Paid | Tax Assessment Tax Assessment Total Assessment is a certain percentage of the fair market value that is determined by local assessors to be the total taxable value of land and additions on the property. | Land | Improvement |
|---|---|---|---|---|
| 2025 | $5,679 | $144,130 | $39,060 | $105,070 |
| 2024 | $5,549 | $144,130 | $39,060 | $105,070 |
| 2023 | $5,362 | $144,130 | $39,060 | $105,070 |
| 2022 | $5,729 | $144,130 | $39,060 | $105,070 |
| 2021 | $3,772 | $85,960 | $31,220 | $54,740 |
| 2020 | $3,772 | $85,960 | $31,220 | $54,740 |
| 2019 | $3,695 | $85,960 | $31,220 | $54,740 |
| 2018 | $3,695 | $85,960 | $31,220 | $54,740 |
| 2017 | $3,325 | $85,960 | $31,220 | $54,740 |
| 2016 | $2,495 | $60,060 | $14,210 | $45,850 |
| 2015 | $2,495 | $60,060 | $14,210 | $45,850 |
| 2014 | $2,495 | $60,060 | $14,210 | $45,850 |
Source: Public Records
Map
Nearby Homes
- 191 Ferry St
- 33 Chapel St
- 32 E Pearl St
- 35 Saltonstall Ave
- 1 Front St Unit 1 Kel
- 43 E Pearl St
- 111 Chapel St
- 72 Pierpont St
- 8 Front St Unit D
- 85 Pierpont St
- 114 Blatchley Ave
- 100 Front St Unit 100
- 56 Woolsey St
- 187 Saltonstall Ave
- 533 Quinnipiac Ave
- 190 Farren Ave
- 193 Farren Ave
- 308 Poplar St
- 213 Saltonstall Ave
- 12 E Ferry St