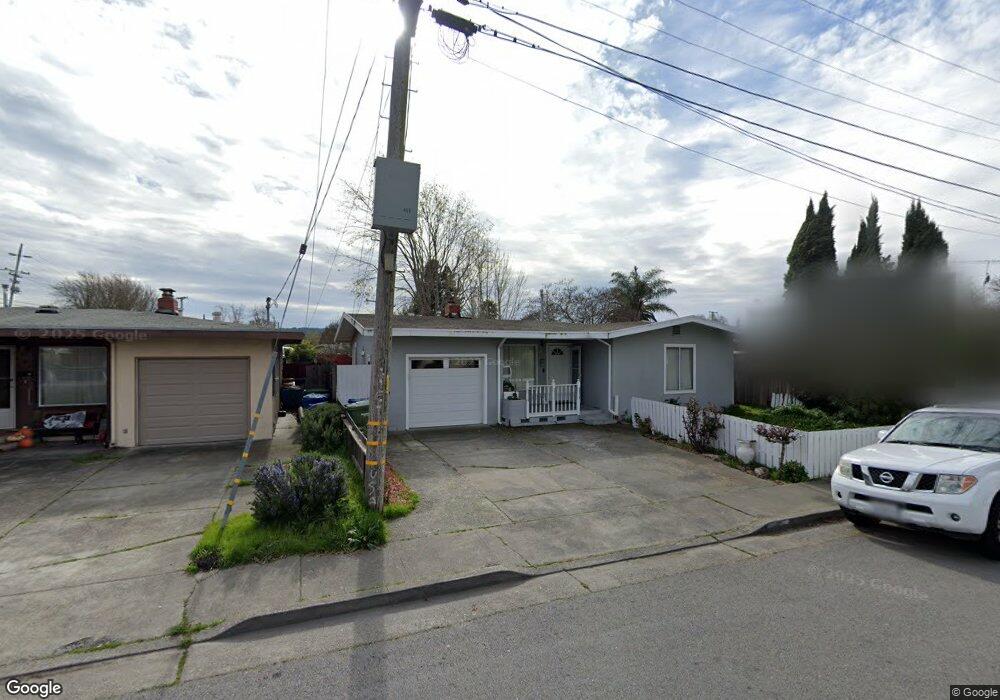
38 Huntington Way Petaluma, CA 94952
Estimated Value: $605,018 - $928,000
3
Beds
1
Bath
1,369
Sq Ft
$526/Sq Ft
Est. Value
About This Home
This home is located at 38 Huntington Way, Petaluma, CA 94952 and is currently estimated at $720,255, approximately $526 per square foot. 38 Huntington Way is a home located in Sonoma County with nearby schools including McKinley Elementary School, Petaluma Junior High School, and Petaluma High School.
Ownership History
Date
Name
Owned For
Owner Type
Purchase Details
Closed on
Jul 26, 2011
Sold by
Martinez Santos Curiel
Bought by
Kirby Road L L C
Current Estimated Value
Purchase Details
Closed on
Dec 15, 2006
Sold by
Martinez Santos Curiel
Bought by
Lopez Martinez Santos Curiel and Lopez Bastides Guadalupe
Purchase Details
Closed on
Mar 27, 2006
Sold by
Wilson Mark
Bought by
Martinez Santos Curiel
Home Financials for this Owner
Home Financials are based on the most recent Mortgage that was taken out on this home.
Original Mortgage
$396,000
Interest Rate
6.25%
Mortgage Type
Fannie Mae Freddie Mac
Purchase Details
Closed on
Oct 28, 1998
Sold by
Wilson Mary E
Bought by
Wilson Mark
Home Financials for this Owner
Home Financials are based on the most recent Mortgage that was taken out on this home.
Original Mortgage
$100,000
Interest Rate
6.6%
Create a Home Valuation Report for This Property
The Home Valuation Report is an in-depth analysis detailing your home's value as well as a comparison with similar homes in the area
Home Values in the Area
Average Home Value in this Area
Purchase History
| Date | Buyer | Sale Price | Title Company |
|---|---|---|---|
| Kirby Road L L C | $188,000 | None Available | |
| Lopez Martinez Santos Curiel | -- | None Available | |
| Martinez Santos Curiel | $495,000 | First American Title Co | |
| Wilson Mark | $175,000 | North American Title Co |
Source: Public Records
Mortgage History
| Date | Status | Borrower | Loan Amount |
|---|---|---|---|
| Previous Owner | Martinez Santos Curiel | $396,000 | |
| Previous Owner | Wilson Mark | $100,000 |
Source: Public Records
Tax History Compared to Growth
Tax History
| Year | Tax Paid | Tax Assessment Tax Assessment Total Assessment is a certain percentage of the fair market value that is determined by local assessors to be the total taxable value of land and additions on the property. | Land | Improvement |
|---|---|---|---|---|
| 2025 | $3,535 | $313,998 | $156,999 | $156,999 |
| 2024 | $3,535 | $307,842 | $153,921 | $153,921 |
| 2023 | $3,535 | $301,806 | $150,903 | $150,903 |
| 2022 | $3,379 | $295,890 | $147,945 | $147,945 |
| 2021 | $3,317 | $290,090 | $145,045 | $145,045 |
| 2020 | $3,345 | $287,116 | $143,558 | $143,558 |
| 2019 | $3,305 | $281,488 | $140,744 | $140,744 |
| 2018 | $3,292 | $275,970 | $137,985 | $137,985 |
| 2017 | $3,225 | $270,560 | $135,280 | $135,280 |
| 2016 | $3,145 | $265,256 | $132,628 | $132,628 |
| 2015 | $3,102 | $261,272 | $130,636 | $130,636 |
| 2014 | $3,088 | $256,156 | $128,078 | $128,078 |
Source: Public Records
Map
Nearby Homes
- 55 Burlington Dr
- 837 Madison St
- 13 Arlington Dr
- 228 S Mcdowell Blvd
- 543 Madison St
- 65 Riverbend Ln
- Plan 3 Craftsman at Riverbend Petaluma - Craftsman
- 531 E Washington St
- 1252 Petaluma Blvd N
- 1638 Lauren Dr
- 29 Alta Dr
- 505 Petaluma Blvd N
- 1645 Lauren Dr
- 601 Reynolds Dr
- 73 Alta Dr
- 0 Lakeville St
- 20 Oakwood Dr
- 1705 Clairmont Ct
- 1688 Kearny Ct
- 63 Oakwood Dr
- 42 Huntington Way
- 34 Huntington Way
- 921 Madison St
- 30 Huntington Way
- 917 Madison St
- 26 Huntington Way
- 57 Huntington Way
- 53 Huntington Way
- 61 Huntington Way
- 95 Wilmington Dr
- 49 Huntington Way
- 913 Madison St
- 14 Huntington Way
- 22 Huntington Way
- 101 Margo Ln
- 45 Huntington Way
- 10 Huntington Way
- 91 Wilmington Dr
- 1008 Madison St
- 6 Huntington Way