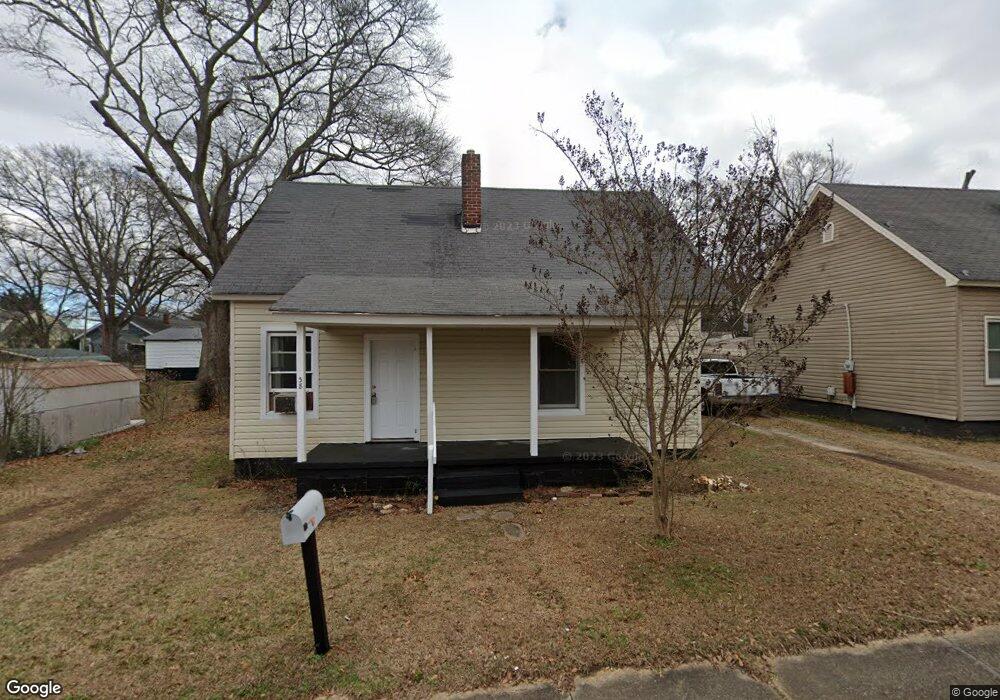
38 Hutchins St Greenville, SC 29605
Dunean NeighborhoodEstimated Value: $201,000 - $246,000
2
Beds
1
Bath
1,000
Sq Ft
$221/Sq Ft
Est. Value
About This Home
This home is located at 38 Hutchins St, Greenville, SC 29605 and is currently estimated at $220,756, approximately $220 per square foot. 38 Hutchins St is a home located in Greenville County with nearby schools including Thomas E. Kerns Elementary School, Hughes Academy of Science & Technology, and Southside High School.
Ownership History
Date
Name
Owned For
Owner Type
Purchase Details
Closed on
Oct 14, 2021
Sold by
Java Holdings Llc
Bought by
Foster Real Estate Exchange Llc
Current Estimated Value
Home Financials for this Owner
Home Financials are based on the most recent Mortgage that was taken out on this home.
Original Mortgage
$2,870,000
Outstanding Balance
$656,331
Interest Rate
2.8%
Mortgage Type
Credit Line Revolving
Estimated Equity
-$435,575
Purchase Details
Closed on
Feb 9, 2017
Sold by
M&L Leasing Llc
Bought by
Coffee Investment Llc
Purchase Details
Closed on
Feb 7, 2011
Sold by
Moody Kenneth E and Locke Richard W
Bought by
M & L Leasing Llc
Purchase Details
Closed on
Jul 1, 2003
Sold by
New Century Properties Ltd Par
Bought by
Locke Richard W
Create a Home Valuation Report for This Property
The Home Valuation Report is an in-depth analysis detailing your home's value as well as a comparison with similar homes in the area
Home Values in the Area
Average Home Value in this Area
Purchase History
| Date | Buyer | Sale Price | Title Company |
|---|---|---|---|
| Foster Real Estate Exchange Llc | $3,500,000 | None Available | |
| Coffee Investment Llc | $20,000 | None Available | |
| M & L Leasing Llc | -- | -- | |
| Locke Richard W | $465,125 | -- |
Source: Public Records
Mortgage History
| Date | Status | Borrower | Loan Amount |
|---|---|---|---|
| Open | Foster Real Estate Exchange Llc | $2,870,000 |
Source: Public Records
Tax History Compared to Growth
Tax History
| Year | Tax Paid | Tax Assessment Tax Assessment Total Assessment is a certain percentage of the fair market value that is determined by local assessors to be the total taxable value of land and additions on the property. | Land | Improvement |
|---|---|---|---|---|
| 2024 | $233 | $0 | $0 | $0 |
| 2023 | $233 | $6,890 | $2,970 | $3,920 |
| 2022 | $2,781 | $6,890 | $2,970 | $3,920 |
| 2021 | $1,142 | $2,160 | $1,250 | $910 |
| 2020 | $1,088 | $1,880 | $630 | $1,250 |
| 2019 | $1,074 | $1,880 | $630 | $1,250 |
| 2018 | $956 | $1,880 | $630 | $1,250 |
| 2017 | $956 | $1,880 | $630 | $1,250 |
| 2016 | $915 | $31,310 | $10,500 | $20,810 |
| 2015 | $915 | $31,310 | $10,500 | $20,810 |
| 2014 | $846 | $28,380 | $10,897 | $17,483 |
Source: Public Records
Map
Nearby Homes