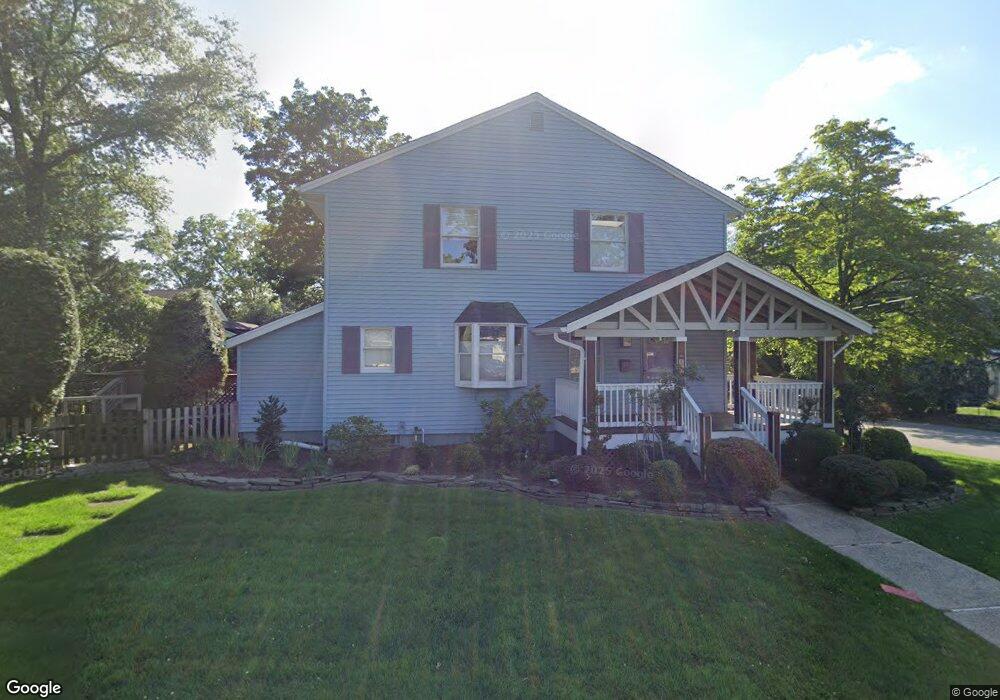
38 Kline St Harrington Park, NJ 07640
Estimated Value: $747,337 - $853,000
--
Bed
--
Bath
1,620
Sq Ft
$496/Sq Ft
Est. Value
About This Home
This home is located at 38 Kline St, Harrington Park, NJ 07640 and is currently estimated at $804,084, approximately $496 per square foot. 38 Kline St is a home located in Bergen County with nearby schools including Harrington Park Elementary School, Northern Valley Regional High School at Old Tappan, and Acton Academy of Bergen County.
Ownership History
Date
Name
Owned For
Owner Type
Purchase Details
Closed on
May 20, 2016
Sold by
Bellizzi Michael J and Bellizzi Darlene
Bought by
Faden Erika L
Current Estimated Value
Home Financials for this Owner
Home Financials are based on the most recent Mortgage that was taken out on this home.
Original Mortgage
$404,000
Interest Rate
3.87%
Mortgage Type
New Conventional
Create a Home Valuation Report for This Property
The Home Valuation Report is an in-depth analysis detailing your home's value as well as a comparison with similar homes in the area
Home Values in the Area
Average Home Value in this Area
Purchase History
| Date | Buyer | Sale Price | Title Company |
|---|---|---|---|
| Faden Erika L | $505,000 | Attorney |
Source: Public Records
Mortgage History
| Date | Status | Borrower | Loan Amount |
|---|---|---|---|
| Open | Faden Erika L | $5,045,050 | |
| Previous Owner | Faden Erika L | $404,000 |
Source: Public Records
Tax History Compared to Growth
Tax History
| Year | Tax Paid | Tax Assessment Tax Assessment Total Assessment is a certain percentage of the fair market value that is determined by local assessors to be the total taxable value of land and additions on the property. | Land | Improvement |
|---|---|---|---|---|
| 2025 | $13,621 | $435,600 | $252,500 | $183,100 |
| 2024 | $13,203 | $435,600 | $252,500 | $183,100 |
| 2023 | $12,985 | $435,600 | $252,500 | $183,100 |
| 2022 | $12,985 | $435,600 | $252,500 | $183,100 |
| 2021 | $12,894 | $435,600 | $252,500 | $183,100 |
| 2020 | $12,837 | $435,600 | $252,500 | $183,100 |
| 2019 | $12,567 | $435,600 | $252,500 | $183,100 |
| 2018 | $12,336 | $435,600 | $252,500 | $183,100 |
| 2017 | $12,206 | $435,600 | $252,500 | $183,100 |
| 2016 | $11,857 | $435,600 | $252,500 | $183,100 |
| 2015 | $11,561 | $435,600 | $252,500 | $183,100 |
| 2014 | $11,295 | $422,900 | $252,500 | $170,400 |
Source: Public Records
Map
Nearby Homes