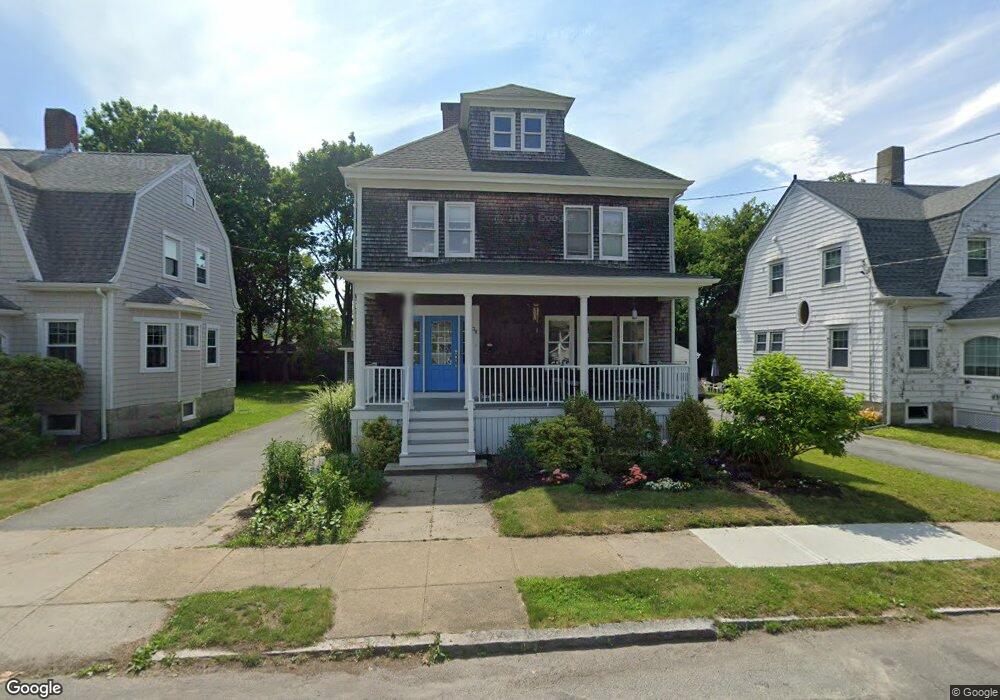
38 Laurel St Fairhaven, MA 02719
Estimated Value: $608,710 - $722,000
4
Beds
2
Baths
1,792
Sq Ft
$370/Sq Ft
Est. Value
About This Home
This home is located at 38 Laurel St, Fairhaven, MA 02719 and is currently estimated at $663,428, approximately $370 per square foot. 38 Laurel St is a home located in Bristol County with nearby schools including Fairhaven High School, City On A Hill Charter Public School New Bedford, and St. Joseph School.
Ownership History
Date
Name
Owned For
Owner Type
Purchase Details
Closed on
May 4, 2007
Sold by
Unger Robert V
Bought by
Robert V Unger Rt and Unger Robert V
Current Estimated Value
Purchase Details
Closed on
Feb 23, 2006
Sold by
Towers Rita T
Bought by
Unger Robert
Home Financials for this Owner
Home Financials are based on the most recent Mortgage that was taken out on this home.
Original Mortgage
$332,500
Interest Rate
6.17%
Mortgage Type
Purchase Money Mortgage
Purchase Details
Closed on
Mar 10, 2004
Sold by
Towers Steven K
Bought by
Towers Rita T
Home Financials for this Owner
Home Financials are based on the most recent Mortgage that was taken out on this home.
Original Mortgage
$270,000
Interest Rate
5.67%
Mortgage Type
Purchase Money Mortgage
Purchase Details
Closed on
Aug 29, 1997
Sold by
Begin Ronald R and Begin Mary L
Bought by
Towers Steven K and Towers Rita T
Create a Home Valuation Report for This Property
The Home Valuation Report is an in-depth analysis detailing your home's value as well as a comparison with similar homes in the area
Home Values in the Area
Average Home Value in this Area
Purchase History
| Date | Buyer | Sale Price | Title Company |
|---|---|---|---|
| Robert V Unger Rt | -- | -- | |
| Unger Robert | $350,000 | -- | |
| Towers Rita T | -- | -- | |
| Towers Steven K | $129,900 | -- |
Source: Public Records
Mortgage History
| Date | Status | Borrower | Loan Amount |
|---|---|---|---|
| Previous Owner | Towers Steven K | $332,500 | |
| Previous Owner | Towers Steven K | $270,000 |
Source: Public Records
Tax History Compared to Growth
Tax History
| Year | Tax Paid | Tax Assessment Tax Assessment Total Assessment is a certain percentage of the fair market value that is determined by local assessors to be the total taxable value of land and additions on the property. | Land | Improvement |
|---|---|---|---|---|
| 2025 | $44 | $476,900 | $241,900 | $235,000 |
| 2024 | $4,373 | $473,800 | $241,900 | $231,900 |
| 2023 | $4,228 | $424,900 | $208,700 | $216,200 |
| 2022 | $3,991 | $390,500 | $190,000 | $200,500 |
| 2021 | $3,924 | $347,600 | $172,800 | $174,800 |
| 2020 | $3,844 | $347,600 | $172,800 | $174,800 |
| 2019 | $3,670 | $314,500 | $148,100 | $166,400 |
| 2018 | $3,591 | $300,300 | $140,900 | $159,400 |
| 2017 | $3,484 | $289,400 | $135,600 | $153,800 |
| 2016 | $3,246 | $266,500 | $132,900 | $133,600 |
| 2015 | $3,198 | $263,200 | $132,900 | $130,300 |
Source: Public Records
Map
Nearby Homes