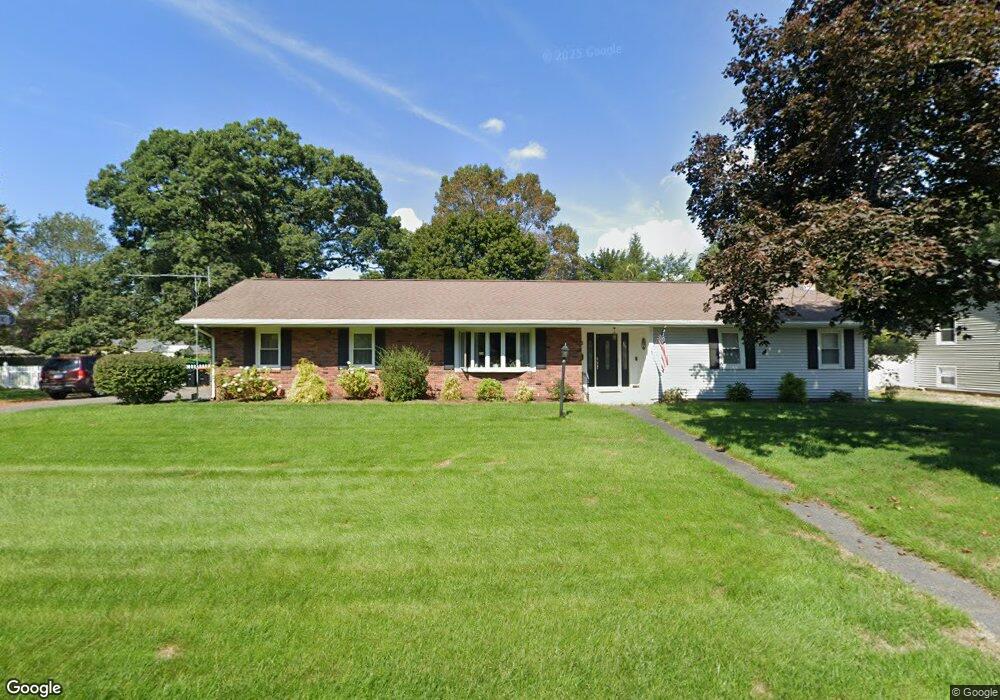
38 Michael Dr South Hadley, MA 01075
Estimated Value: $441,000 - $597,000
3
Beds
2
Baths
1,390
Sq Ft
$358/Sq Ft
Est. Value
About This Home
This home is located at 38 Michael Dr, South Hadley, MA 01075 and is currently estimated at $497,916, approximately $358 per square foot. 38 Michael Dr is a home located in Hampshire County with nearby schools including Plains Elementary School, Mosier Elementary School, and Michael E. Smith Middle School.
Ownership History
Date
Name
Owned For
Owner Type
Purchase Details
Closed on
Aug 25, 2004
Sold by
Carlson Karen A and Carlson Kenneth C
Bought by
Brown James P and Brown Susan M
Current Estimated Value
Purchase Details
Closed on
Jul 29, 1994
Sold by
Mullen Roy L and Mullen Hilda T
Bought by
Carlson Kenneth C and Carlson Karen
Create a Home Valuation Report for This Property
The Home Valuation Report is an in-depth analysis detailing your home's value as well as a comparison with similar homes in the area
Home Values in the Area
Average Home Value in this Area
Purchase History
| Date | Buyer | Sale Price | Title Company |
|---|---|---|---|
| Brown James P | $280,000 | -- | |
| Carlson Kenneth C | $160,000 | -- |
Source: Public Records
Mortgage History
| Date | Status | Borrower | Loan Amount |
|---|---|---|---|
| Closed | Carlson Kenneth C | $145,000 | |
| Closed | Carlson Kenneth C | $58,000 | |
| Closed | Carlson Kenneth C | $157,000 |
Source: Public Records
Tax History Compared to Growth
Tax History
| Year | Tax Paid | Tax Assessment Tax Assessment Total Assessment is a certain percentage of the fair market value that is determined by local assessors to be the total taxable value of land and additions on the property. | Land | Improvement |
|---|---|---|---|---|
| 2025 | $7,393 | $464,100 | $141,900 | $322,200 |
| 2024 | $7,418 | $445,500 | $132,600 | $312,900 |
| 2023 | $6,502 | $370,500 | $120,200 | $250,300 |
| 2022 | $6,228 | $337,000 | $120,200 | $216,800 |
| 2021 | $6,151 | $316,100 | $112,300 | $203,800 |
| 2020 | $5,860 | $293,900 | $112,300 | $181,600 |
| 2019 | $5,576 | $276,700 | $107,100 | $169,600 |
| 2018 | $5,375 | $269,700 | $104,100 | $165,600 |
| 2017 | $5,205 | $258,700 | $104,100 | $154,600 |
| 2016 | $4,937 | $248,700 | $95,000 | $153,700 |
| 2015 | $4,686 | $241,800 | $92,000 | $149,800 |
Source: Public Records
Map
Nearby Homes